Part of this study included determining the expected decay rate of tritium in the tanks, assuming the tanks remained intact and no tritium leaked into the surrounding sediment. Given these assumptions, how long will it be before the concentration of tritium in the tank falls below the US EPA drinking water standards of 20,000 pCi/L?
In this example we calculate the expected decay rate and overplot that with actual measurements taken periodically from the tank.
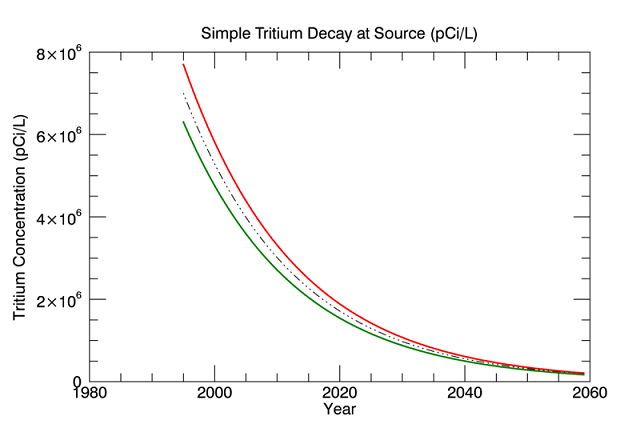
Create Expected Tritium Decay Plot Inside Source (Tank)
Create a plot showing the possible impact of radioactive decay on the concentration of tritium over time inside in one of the storage tanks. For this example, we assume an initial year of 1995 (the year when the tank was filled and capped), the number of years to calculate = 65, and the assumed initial concentration of tritium in the tank, based on initial measurements, at 7,000,000 pCi/L.
iYear = 1995
nYR = 65
decay = (-(ALOG(2))/12.32)
ipCi = 7000000
pCi = (ipCi*EXP(decay*FINDGEN(nYR)))
pCiHigh = ((pCi)*1.10)
pCiLow = ((pCi)*0.90)
year = (iYear+FINDGEN(nYR))
myPlot = PLOT(year, pCi, $
DIMENSIONS=[800, 550], LINESTYLE=4, $
TITLE="Simple Tritium Decay at Source (pCi/L)", $
XTITLE="Year", YTITLE="Tritium Concentration (pCi/L)", $
NAME='Expected')
high = PLOT(year, pCiHigh, COLOR='red', $
DIMENSIONS=[800, 550], /OVERPLOT, $
THICK=2, NAME='+10%')
low = PLOT(year, pCiLow, COLOR='green', $
DIMENSIONS=[800, 550], /OVERPLOT, $
THICK=2, NAME='-10%')
IDL displays:
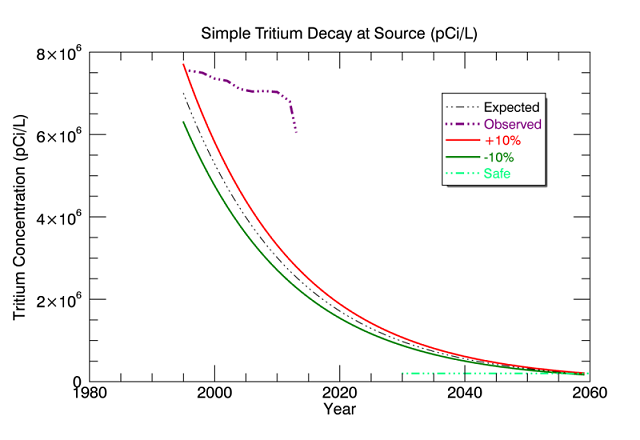
These simulated data could be overplotted with observed values measured periodically inside the tank to characterize how well the boundary conditions were modeled, and how close the decay simulation is to reality. We will also plot a line representing the US Environmental Protection Agency's (EPA) "safe" concentration of tritium in drinking water of 20,000 pCi/L.
year = [2030,2040,2060]
safe = [2e5,2e5,2e5]
safePlot = PLOT(year, safe, DIMENSIONS=[800, 550], $
COLOR='spring green', NAME='Safe', $
/OVERPLOT, THICK=2, LINESTYLE=4)
obsYear = [1996,1998,2000,2002,2004,2006, $
2008,2010,2012,2013]
obsCi = [7545000,7499020,7355300,7301000,7103090, $
7042150,7054110,7030110,6802000,6075300]
myObs = PLOT(obsYear, obsCi, LINESTYLE=4, COLOR='purple', $
THICK=3, /OVERPLOT, NAME='Observed')
myLegend = LEGEND(TARGET=[myPlot,myObs,high,low,safePlot], /DATA, $
/AUTO_TEXT_COLOR, FONT_SIZE=10, POSITION=[2055,7e6])
The new plot should look like:
Analysis and Further Investigations
From this plot we can see that the assumed initial concentration of 7,000,000 pCi/L was not quite correct and that the decay of tritium did not proceed as expected. Since observed concentrations vary markedly from expected, we might decide to further investigate the conditions at this particular storage tank. Was more nuclear waste deposited here than we initially assumed? Was the concentration higher than expected? Were additional and undocumented deposits made after 1995?
Getting the answers to these questions will also impact the modeling of the future state of the tritium plume since this is partially dependent on how much and when waste was deposited in the tank.
We can also tell from the plot alone that levels of tritium in this tank will not reach the EPA's "safe" level of 20,000 pCi/L until sometime around 2055, assuming that the "Expected" line is accurate.
Other Topics in this Series
See Also
ALOG, EXP, FINDGEN, LEGEND, PLOT