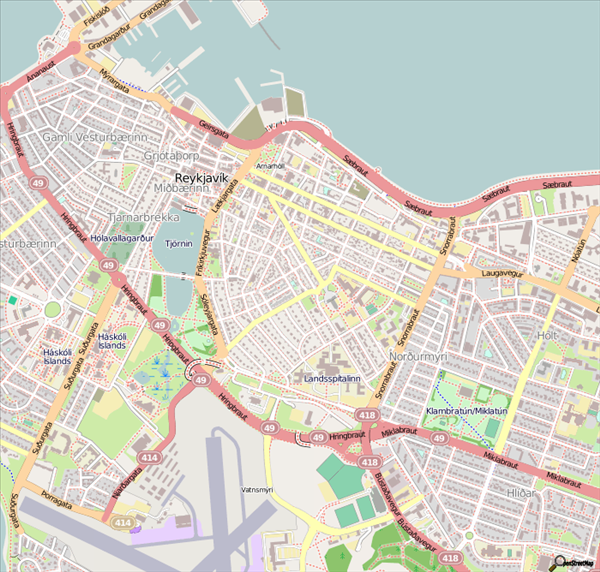
This example demonstrates how to download a map image from OpenStreetMap and display the image in the correct map projection.
Load a Map File
Load the reykjavik.png file from the IDL distribution:
file = FILEPATH('reykjavik.png', SUBDIRECTORY = ['examples', 'data'])
READ_PNG, file, img
Display the Map Image with the Map Projection
Both the Google Maps API and the OpenStreetMap API provide static map images in the Mercator projection with a spherical ellipsoid of radius 6,378,137 meters. To correctly display these map images in IDL, convert the center longitude/latitude and map zoom factor into the bounding box for the image, in meters.
centerLon = -21.93d
centerLat = 64.1425d
zoom = 14
Re = 6378137
resolution = (2*!DPI*Re)/(256*2d^zoom)
deltax = 700*resolution
deltay = 668*resolution
m = MAP('Mercator', /BUFFER, $
SEMIMAJOR_AXIS=6378137d, SEMIMINOR_AXIS=6378137d)
uv = m.MapForward(centerLon, centerLat)
x0 = uv[0] - deltax/2
x1 = uv[0] + deltax/2
y0 = uv[1] - deltay/2
y1 = uv[1] + deltay/2
m.Close
PRINT, [x0, y0, x1, y1]
IDL prints:
-2444580.6 9382851.8 -2437892.3 9389234.3
Now that the bounding box is in meters (image coordinates), you have the information you need to construct the map. Use the image bounding box to specify the image location and dimensions.
im = IMAGE(img, GRID_UNITS='meters', $
MAP_PROJECTION='Mercator', $
SEMIMAJOR_AXIS=6378137d, SEMIMINOR_AXIS=6378137d, $
DIMENSIONS=[800, 800], $
IMAGE_LOCATION=[x0, y0], $
IMAGE_DIMENSIONS=[deltax, deltay])
mg = im.mapgrid
mg.LINESTYLE = 1
mg.LABEL_POSITION = 1
FOREACH l, mg.longitudes DO l.LABEL_ANGLE = 0
FOREACH l, mg.latitudes DO l.LABEL_ANGLE = 270
mg.BOX_AXES = 1
mg.BOX_THICK = 3
s = SYMBOL(-21.922311d, 64.147597d, 'star', /DATA, $
SYM_SIZE=4, /SYM_FILLED, SYM_FILL_COLOR='yellow')
t = TEXT(-21.9215d, 64.148d, 'Sólfar (Sun Voyager)', /DATA, $
/FILL_BACKGROUND, FILL_COLOR='white')
IDL displays the resulting image of Reykjavik:
