You can create line plots using the PLOT function. In this topic, we will use the PLOT function plot a short series of data elements.
For an additional example of using line plots, see Plot Supporting Information in the Environmental Monitoring Long Example.
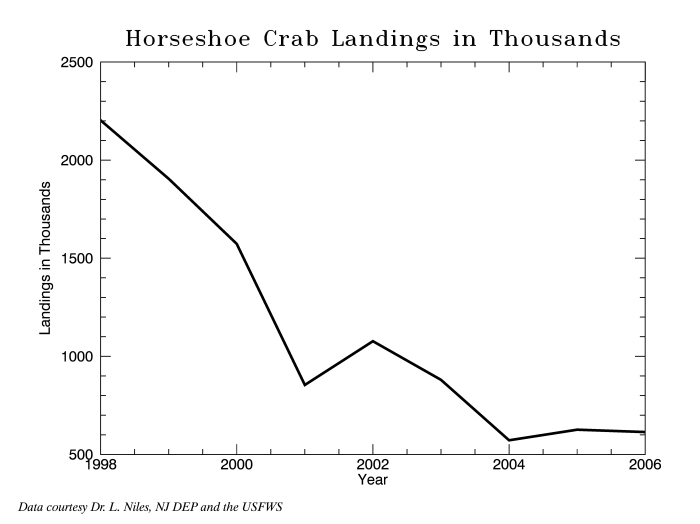
year = [1998, 1999, 2000, 2001, 2002, 2003, 2004, 2005, 2006]
landings = [2203, 1905, 1573, 854, 1077, 880, 572, 626, 614]
graph = plot(year, landings, TITLE='Horseshoe Crab Landings in Thousands', $
XTITLE='Year', YTITLE='Landings in Thousands', $
thick=3, color='black')
You can change the plot title font or add a note using the control icons in the plot window ("Annotate" shown on the left and "Text" on the right):

Alternatively, change plot properties by typing in the following at the IDL command line:
graph.title.font_size = 16
graph.title.font_style = "Bold"
graph.thick = 3
References and Resources
Niles, Lawrence, et. al., 2008. Status of the Red Knot (Caladris canutus rufa) in the Western Hemisphere. Studies in Avian Biology, No. 36.
See Also