Each Axis in an IDL Graphic has a numeric reference that can be used to modify its properties after a graphic's creation. This topic presents the axis references for both two and three-dimensional graphics.
Axis References for Two-Dimensional Graphics
Each axis in a two-dimensional graphic is referenced by a number within IDL. Axis numbering begins with "0" (zero) for the bottom x-axis and continues clockwise to "3" for the right-hand y-axis. See the plot below for more detail:
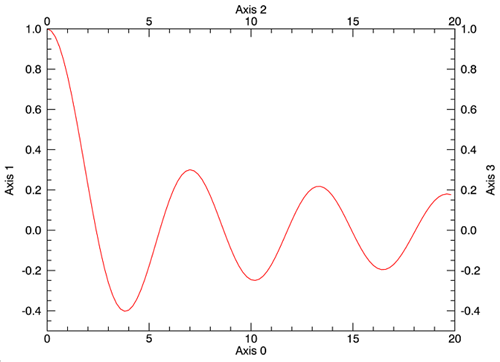
To generate this plot, copy and paste the following code to the IDL command line:
x = findgen(100)/5
y = beselj(x)
myPlot = PLOT(x, y, COLOR='red', NAME='bessel_j0')
myPlot['axis0'].TITLE = 'Axis 0'
myPlot['axis1'].TITLE = 'Axis 1'
myPlot['axis2'].TITLE = 'Axis 2'
myPlot['axis2'].SHOWTEXT = 1
myPlot['axis3'].TITLE = 'Axis 3'
myPlot['axis3'].SHOWTEXT = 1
You may notice that by default, IDL does not display the numbering and titles for the upper x-axis and the right y-axis. To toggle axis text on or off use the SHOWTEXT property. For additional information on SHOWTEXT or other axis properties, see the AXIS function topic.
Axes for Three-Dimensional Graphics
Axis numbers are slightly different in three-dimensional graphics. The primary axes are numbered "0" for the x-axis, "1" for the y-axis, and "2" for the z-axis. See the graphic below for the numeric references of the remaining axes.
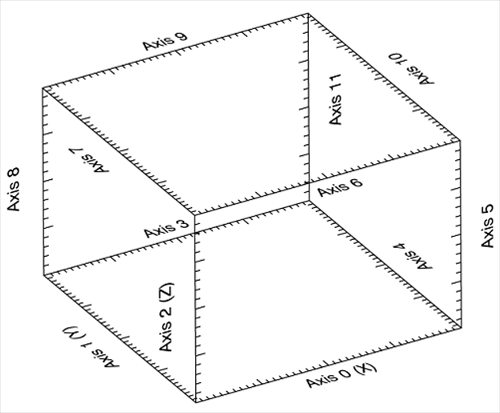
To generate this plot yourself, copy and paste the following code to the IDL command line:
x = FINDGEN(200)
my3DPlot = plot3d(x * cos(x/10), x*sin(x/10), x, 'b2d', AXIS_STYLE=2, /NODATA, $
xtickname=REPLICATE(' ', 5), $
ytickname=REPLICATE(' ', 5), $
ztickname=REPLICATE(' ', 5))
my3DPlot['axis0'].TITLE = 'Axis 0 (X)'
my3DPlot['axis1'].TITLE = 'Axis 1 (Y)'
my3DPlot['axis2'].TITLE = 'Axis 2 (Z)'
my3DPlot['axis3'].TITLE = 'Axis 3'
my3DPlot['axis3'].SHOWTEXT = 1
my3DPlot['axis4'].TITLE = 'Axis 4'
my3DPlot['axis4'].SHOWTEXT = 1
my3DPlot['axis5'].TITLE = 'Axis 5'
my3DPlot['axis5'].SHOWTEXT = 1
my3DPlot['axis6'].TITLE = 'Axis 6'
my3DPlot['axis6'].SHOWTEXT = 1
my3DPlot['axis7'].TITLE = 'Axis 7'
my3DPlot['axis7'].SHOWTEXT = 1
my3DPlot['axis8'].TITLE = 'Axis 8'
my3DPlot['axis8'].SHOWTEXT = 1
my3DPlot['axis9'].TITLE = 'Axis 9'
my3DPlot['axis9'].SHOWTEXT = 1
my3DPlot['axis10'].TITLE = 'Axis 10'
my3DPlot['axis10'].SHOWTEXT = 1
my3DPlot['axis11'].TITLE = 'Axis 11'
my3DPlot['axis11'].SHOWTEXT = 1
If you create the graphic and have trouble reading any of the axis titles, use your mouse to select and rotate the graphic as needed. Again, by default, IDL does not display the numbering and titles for the upper x-axis and the right y-axis. To toggle axis text on or off use the SHOWTEXT property. For additional information on SHOWTEXT or other axis properties, see the AXIS function topic.
Using Axis References
You can use these numeric axis references to change the properties of an axis after the creation of a graphic. See the topics Change Graphics Properties and Axes for more information.
See Also
AXIS function, Axes, Change Graphics Properties, IMAGE, PLOT, PLOT3D