You can create three-dimensional plot graphics using the PLOT3D function. In this topic, we will use the PLOT3D function using three variables to display a three-dimensional plot.
The example below displays a very simple three-dimensional plot using example data:
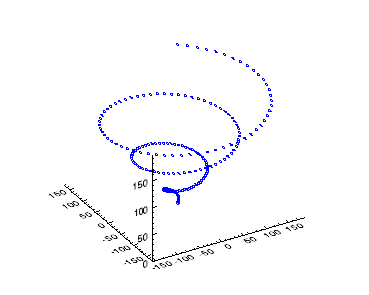
The code shown below creates the graphic shown above. You can copy the entire block and paste it into the IDL command line to run it. The properties used are explained in detail after the example code.
x = FINDGEN(200)
my3DPlot = PLOT3D(x *COS(x/10), x*SIN(x/10), x, 'b2d')
Resources