The VECTOR function allows you to draw vectors in a graphic. The following example displays wind vector data over a map with continental outlines.
For an additional example using VECTOR, see Plot Relative Aquifer Flow Vectors in the Environmental Monitoring Long Example.
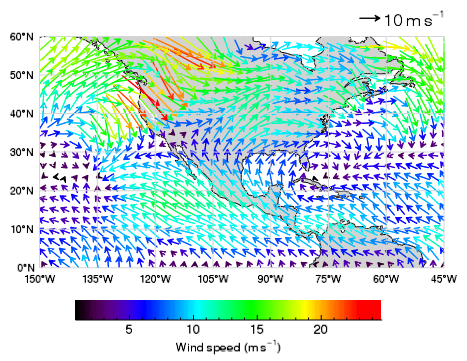
The following code creates the graphic at the right. You can copy the entire block and paste it into the IDL command line to run it.
RESTORE, FILEPATH('globalwinds.dat', SUBDIR=['examples','data'])
m = MAP('Equirectangular', LIMIT=[0,-150,60,-45], $
LABEL_POSITION=0, LABEL_ANGLE=0, $
COLOR='light gray', LABEL_COLOR='black')
cont = MAPCONTINENTS(FILL_COLOR='light gray')
vec = VECTOR(u, v, x, y, /OVERPLOT, $
MIN_VALUE=0, MAX_VALUE=25, $
RGB_TABLE=39, AUTO_COLOR=1, LENGTH_SCALE=2)
l = Legend(SAMPLE_MAGNITUDE=10, UNITS='$m s^{-1}$', $
POSITION=m.MapForward(-45,61), /DATA, $
VERTICAL_ALIGNMENT='bottom')
c = Colorbar(TARGET=vec, POSITION=[0.2,0.1,0.8,0.15], $
TITLE='Wind speed $(m s^{-1})$')
Resources