The following example shows how to create a property sheet for multiple components.
Enter the following text in the IDL Editor:
PRO PropertyEvent, event
IF (event.type EQ 0) THEN BEGIN
PRINT, 'Changed: ', event.component
PRINT, ' ', event.identifier, ': ', $
WIDGET_INFO(event.id, COMPONENT = event.component, $
PROPERTY_VALUE = event.identifier)
ENDIF ELSE BEGIN
PRINT, 'Selected: ' + event.identifier
ENDELSE
END
PRO CleanupEvent, baseID
WIDGET_CONTROL, baseID, GET_UVALUE = objects
FOR i = 0, (N_ELEMENTS(objects) - 1) DO $
OBJ_DESTROY, objects[i]
END
PRO ExMultiSheet_event, event
ps = WIDGET_INFO(event.id, $
FIND_BY_UNAME = 'PropSheet')
geo_tlb = WIDGET_INFO(event.id, /GEOMETRY)
WIDGET_CONTROL, ps, $
SCR_XSIZE = geo_tlb.xsize - (2*geo_tlb.xpad), $
SCR_YSIZE = geo_tlb.ysize - (2*geo_tlb.ypad)
END
PRO ExMultiSheet
tlb = WIDGET_BASE(/COLUMN, /TLB_SIZE_EVENTS, $
KILL_NOTIFY = 'CleanupEvent')
oComp1 = OBJ_NEW('IDLitVisAxis', $
COLOR = RANDOMU(s1, 3)*256, $
TEXT_COLOR = RANDOMU(s7, 3)*256)
oComp2 = OBJ_NEW('IDLitVisAxis', $
COLOR = RANDOMU(s2, 3)*256, $
TEXT_COLOR = RANDOMU(s8, 3)*256)
oComp3 = OBJ_NEW('IDLitVisAxis', $
COLOR = RANDOMU(s3, 3)*256, $
TEXT_COLOR = RANDOMU(s9, 3)*256)
oComp4 = OBJ_NEW('IDLitVisAxis', $
COLOR = RANDOMU(s4, 3)*256, $
TEXT_COLOR = RANDOMU(s10, 3)*256)
oComp5 = OBJ_NEW('IDLitVisAxis', $
COLOR = RANDOMU(s5, 3)*256, $
TEXT_COLOR = RANDOMU(s11, 3)*256)
oComp6 = OBJ_NEW('IDLitVisAxis', $
COLOR = RANDOMU(s6, 3)*256, $
TEXT_COLOR = RANDOMU(s12, 3)*256)
oComps = [oComp1, oComp2, oComp3, $
oComp4, oComp5, oComp6]
WIDGET_CONTROL, tlb, SET_UVALUE = oComps
oComp2->SetPropertyAttribute, 'color', /HIDE
oComp2->SetPropertyAttribute, 'ticklen', /HIDE
oComp5->SetPropertyAttribute, 'ticklen', /HIDE
prop = WIDGET_PROPERTYSHEET(tlb, $
UNAME = 'PropSheet', $
VALUE = oComps, $
FONT = 'Courier New*16', $
XSIZE = 100, YSIZE = 24, $
/FRAME, EVENT_PRO = 'PropertyEvent')
WIDGET_CONTROL, tlb, /REALIZE
XMANAGER, 'ExMultiSheet', tlb, /NO_BLOCK
END
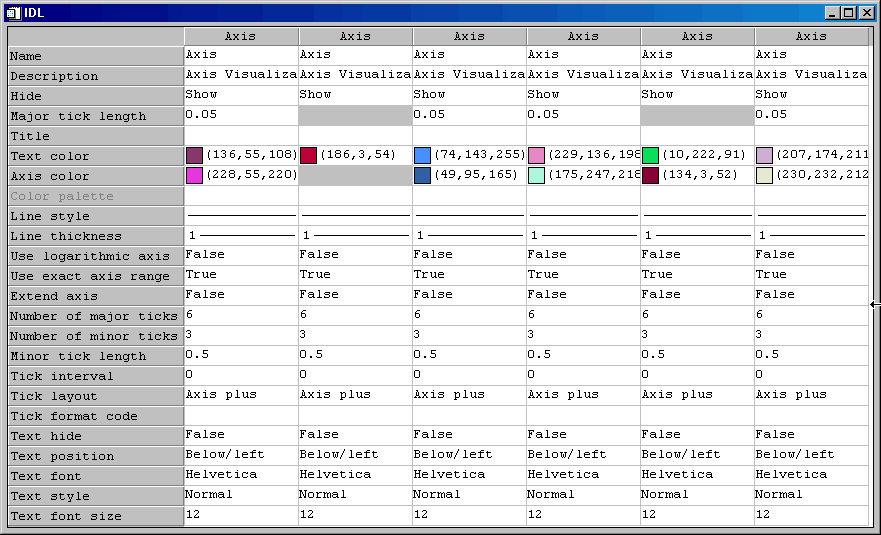
Save the program as ExMultiSheet.pro, then compile and run it. A property sheet displaying the properties of six axes is displayed:

The gray boxes indicate properties that have been hidden. To remove the gray boxes, comment out the code after the following comment:
The text is displayed at 16 points in the Courier New font. To view the property sheet with the text displayed in the default size and font, comment out the following segment of the property sheet creation code:
FONT = "Courier New*16", $
To see the text displayed in a font and size of your choosing, edit the same segment to include a different font name and size.