The IMSL_NORM2SAMP function computes statistics for mean and variance inferences using samples from two independently normal populations.
This routine requires an IDL Advanced Math and Stats license. For more information, contact your sales or technical support representative.
The IMSL_NORM2SAMP function computes statistics for making inferences about the means and variances of two normal populations, using independent samples in x1 and x2. For inferences concerning parameters of a single normal population, see IMSL_NORM1SAMP.
Let µ1 and σ21 be the mean and variance of the first population, and let µ2 and σ22 be the corresponding quantities of the second population. The function contains test statistics and confidence intervals for difference in means, equality of variances, and the pooled variance.
The means and variances for the two samples are as follows:
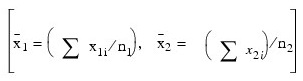
and:
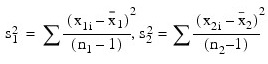
Inferences About the Means
The test that the difference in means equals a certain value, for example, µ0, depends on whether or not the variances of the two populations can be considered equal. If the variances are equal and T_TEST_NULL_HYP equals zero, the test is the two-sample t test, which is equivalent to an analysis-of-variance test. The pooled variance for the difference-in-means test is as follows:
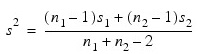
The t statistic is as follows:
Also, the confidence interval for the difference in means can be obtained by specifying CI_DIFF_EQ_VAR.
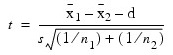
If the population variances are not equal, the ordinary t statistic does not have a t distribution and several approximate tests for the equality of means have been proposed. (For example, see Anderson and Bancroft 1952, and Kendall and Stuart 1979.) One of the earliest tests devised for this situation is the Fisher-Behrens test, based on Fisher’s concept of fiducial probability. A procedure used if T_TEST_NE_VAR and/or CI_DIFF_NE_VAR are specified is the Satterthwaite’s procedure, as suggested by H.F. Smith and modified by F.E. Satterthwaite (Anderson and Bancroft 1952, p. 83).
The test statistic is:
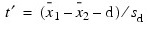
where:
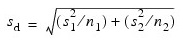
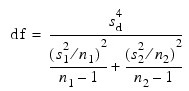
Under the null hypothesis of µ1 – µ2 = d, this quantity has an approximate t distribution with degrees of freedom given by the following equation:
Inferences about the Variances
The F statistic for testing the equality of variances is given by:
F = s2max / s2min,
where s2max is the maximum of s21 and s22 . If the variances are equal, this quantity has an F distribution with n1 – 1 and n2 – 1 degrees of freedom, where n1 is the sample size corresponding to s2max.
Generally, it is not recommended that the results of the F test be used to decide whether to use the regular t test or the modified t′ on a single set of data. The modified t′ (Satterthwaite’s procedure) is the more conservative approach to use if there is doubt about the equality of the variances.
Examples
Example 1
This example, taken from Conover and Iman (1983, p. 294), involves scores on arithmetic tests of two grade-school classes. The question is whether a group taught by an experimental method has a higher mean score. Only the difference in means is output. The data are shown below.
|
Scores for Standard Group
|
Scores for Experimental Group
|
|
72 |
111 |
|
75 |
118 |
|
77 |
128 |
|
80 |
138 |
|
104 |
140 |
|
110 |
150 |
|
125 |
163 |
|
|
164 |
|
|
169 |
x1 = [72, 75, 77, 80, 104, 110, 125]
x2 = [111, 118, 128, 138, 140, 150, 163, 164, 169]
PRINT, 'difference of means = ', IMSL_NORM2SAMP(x1, x2)
IDL prints:
difference of means = -50.4762
Example 2
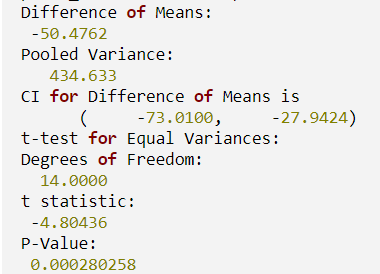
The same data is used for this example as for the initial example. Here, the results of the t test are output. The variances of the two populations are assumed to be equal. It is seen from the output that there is strong reason to believe that the two means are different (t value of –4.804). Since the lower 97.5-percent confidence limit does not include zero, the null hypothesis is that µ1 ≤ µ2 would be rejected at the 0.05 significance level. (The closeness of the values of the sample variances provides some qualitative substantiation of the assumption of equal variances.) First, define a procedure to print the results.
PRO print_results, diff, sp, ci, t
PM, diff, Title = 'Difference of Means: '
PM, sp, Title = 'Pooled Variance: '
PM, 'CI for Difference of Means is (', ci(0), ',', ci(1), ')'
PM, ' '
PM, 't-test for Equal Variances:'
PM, t(0), Title = 'Degrees of Freedom:'
PM, t(1), Title = 't statistic: '
PM, t(2), Title = 'P-Value:'
END
x1 = [72, 75, 77, 80, 104, 110, 125]
x2 = [111, 118, 128, 138, 140, 150, 163, 164, 169]
diff = IMSL_NORM2SAMP(x1, x2, Pooled_Var = sp, $
Ci_Diff_Eq_Var = ci, T_Test_Eq_Var = t)
print_results, diff, sp, ci, t
IDL prints:
Syntax
Result = IMSL_NORM2SAMP(X1, X2 [, CI_DIFF_EQ_VAR=variable] [, CI_DIFF_NE_VAR=variable] [, CONF_MEAN=value] [, CONF_VAR=value] [, CI_COMM_VAR=variable] [, CI_RATIO_VAR=variable] [, CHI_SQ_NULL_HYP=value] [, CHI_SQ_TEST=variable] [, /DOUBLE] [, F_TEST=variable] [, MEAN_X1=value] [, MEAN_X2=value] [, POOLED_VAR=variable] [, STDEV_X1=variable] [, STDEV_X2=variable] [, T_TEST_EQ_VAR=variable] [, T_TEST_NE_VAR=variable] [, T_TEST_NULL_HYP=value])
Return Value
Difference in means of the mean of the second sample from the first sample.
Arguments
X1
One-dimensional array containing the first sample.
X2
One-dimensional array containing the second sample.
Keywords
CI_DIFF_EQ_VAR (optional)
Named variable into which the two-element array containing the lower confidence limit and the upper limit for the mean of the first population minus the mean of the second, assuming equal variances is stored.
CI_DIFF_NE_VAR (optional)
Named variable into which the two-element array containing the lower confidence limit and the upper limit for the mean of the first population minus the mean of the second, assuming unequal variances, is stored.
CONF_MEAN (optional)
Confidence level for two-sided interval estimate of the mean of x1 minus the mean of x2, in percent. The keyword CONF_MEAN must be between 0.0 and 100.0 and is often 90.0, 95.0, or 99.0. For a one-sided confidence interval with confidence level c (at least 50 percent), set CONF_MEAN = 100.0 – 2.0 x (100.0 – c). Default: 95.0
CONF_VAR (optional)
Confidence level for inference on variances. Under the assumption of equal variances, the pooled variance is used to obtain a two-sided CONF_VAR percent confidence interval for the common variance if CI_COMM_VAR is specified. Without making the assumption of equal variances, the ratio of the variances is of interest. A two-sided CONF_VAR percent confidence interval for the ratio of the variance of the first sample to that of the second sample is computed and is returned if CI_RATIO_VAR is specified. The confidence intervals are symmetric in probability. Default: 95.0
CI_COMM_VAR (optional)
Named variable into which the two-element array containing the lower confidence limit and the upper confidence limit for the common (or pooled) variance is stored.
CI_RATIO_VAR (optional)
Named variable into which the two-element array containing the approximate lower confidence limit and the approximate upper confidence limit for the ratio of the variance of the first population to the second is stored.
CHI_SQ_NULL_HYP (optional)
Null hypothesis value for the chi-squared test. Default: 1.0
CHI_SQ_TEST (optional)
Named variable into which the three-element array containing statistics associated with the chi-squared test for σ2 = σ2 , where σ2 is the common (or pooled) variance and σ20 is the null hypothesis value, is stored. (See the description for the CHI_SQ_NULL_HYP keyword.) The first element contains the degrees of freedom, the second element contains the chi-squared value, and the third element contains the probability of a larger chi-squared value, p-value. This test assumes equal variances.
DOUBLE (optional)
If present and nonzero, double precision is used.
F_TEST (optional)
Named variable into which the four-element array containing statistics associated with the F test for equality of variances is stored. The first element contains the degrees of freedom for the numerator, the second element contains the degrees of freedom for the denominator, the third element contains the F test value, and the fourth element contains the probability of a larger F value, p-value, assuming the null hypothesis (H0: σ2 = σ2 ) is true.
MEAN_X1 (optional)
Means of the first sample.
MEAN_X2 (optional)
Means of the second sample.
POOLED_VAR (optional)
Named variable into which the pooled variance for the two samples is stored.
STDEV_X1 (optional)
Named variable into which the standard deviation of the first sample is stored.
STDEV_X2 (optional)
Named variable into which the standard deviation of the second sample is stored.
T_TEST_EQ_VAR (optional)
Variable into which the three-element array containing statistics associated with a t test for µ1 – µ2 = d, where d is the null hypothesis value, is stored. (See the description of T_TEST_NULL_HYP.) The first element contains degrees of freedom, second element contains the t value, and third element contains the probability of a larger t in absolute value, assuming the null hypothesis is true. This test assumes equal variances.
T_TEST_NE_VAR (optional)
Named variable into which the three-element array containing statistics associated with a t test for µ1 – µ2 = d, where d is the null hypothesis value, is stored. (See the description for the T_TEST_NULL_HYP keyword.) The first element contains the degrees of freedom for Satterthwaite’s approximation, the second element contains the t value, and the third element contains the probability of a larger t in absolute value, assuming the null hypothesis is true. This test does not assume equal variances.
T_TEST_NULL_HYP (optional)
Null hypothesis value for the t test. Default: 0.0
Version History
See Also
IMSL_NORM1SAMP