The STREAMLINE function allows you to draw streamlines in a graphic. The following example displays streamlines of global wind vector data over a global map with continental outlines.
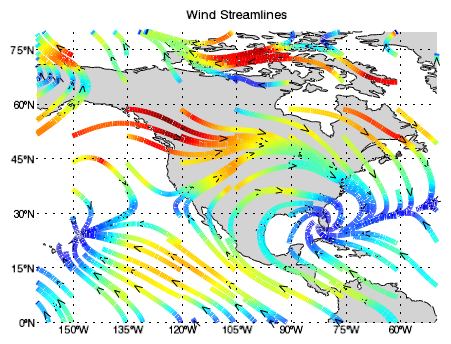
The code shown below creates the graphic shown above. You can copy the entire block and paste it into the IDL command line to run it.
RESTORE, FILEPATH('globalwinds.dat', SUBDIR=['examples','data'])
map = MAP('Equirectangular', POSITION=[0.1,0.1,0.9,0.9], $
LIMIT=[0,-160,80,-50], TITLE='Wind Streamlines')
grid = map.MAPGRID
grid.LINESTYLE = "dotted"
grid.ANTIALIAS = 0
grid.LABEL_POSITION = 0
grid.LABEL_ANGLE = 0
grid.FONT_SIZE=11
cont = MAPCONTINENTS(FILL_COLOR="light gray")
stream = STREAMLINE(u, v, x, y, /OVERPLOT, $
STREAMLINE_STEPSIZE=0.05, $
RGB_TABLE=33, AUTO_COLOR=1, THICK=5)
Resources