The K Nearest Neighbor (KNN) method computes the Euclidean distance from each segment in the segmentation image to every training region that you define. The distance is measured in n-dimensional space, where n is the number of attributes for that training region.
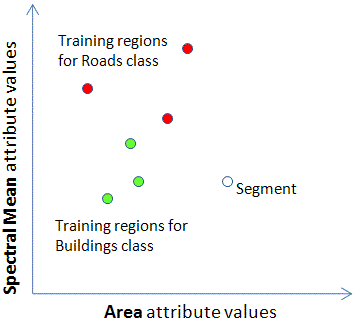
As a simple example, say you have two classes, each with three training samples (ideally, you should define several more classes and training regions for best classification results):

ENVI computes attributes for every training region that you define. You can choose which attributes to compute; see Select Attributes for Classification for more information. The KNN method weights all attributes equally.
Assume that you have only two attributes, Area and Spectral_Mean for one band. The training regions are shown in a 2D graph of attribute values as follows:

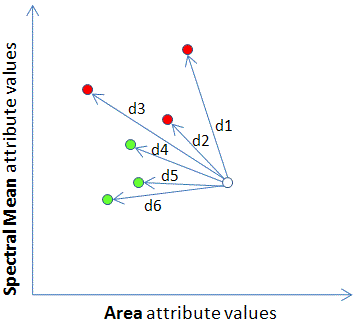
The following figure shows distances from one segment to all of the training regions (i.e., its neighbors).

Use the Neighbors field to set the number of neighboring training regions to consider. Enter an odd integer value, ranging from 1 to a value less than or equal to the total number of training regions for all classes. Since there are six neighboring training regions in this example, you could set the Neighbors field to 1, 3, or 5. A higher value takes into account more neighbors when choosing a target class and may reduce noisy or irrelevant features. A value of 1 means the segment is assigned to the class of its nearest neighbor.
Assume for this example that you set the Neighbors field to 5. The distances are sorted from shortest to longest, so the order is [d2, d5, d4, d6, d1]. The number of neighbors is used in a majority vote to determine the assigned class. Three of the distances in the list (d4, d5, and d6) are to the Buildings class (green points), while only two (d1 and d2) are to the Roads class (red points). So this particular segment is initially assigned to the Buildings class.
Use the Threshold slider to indicate your level of confidence that the closest segments of any given segment (in the segmentation image) represent the same class as that segment. Higher values mean more confidence, so only the nearest segments will be classified. As you increase the value of the Threshold, the Preview Window will show more unclassified segments. Lower values mean that you are unsure if the closest neighbors represent the same class, so more distant segments will be classified. As you decrease the value of the Threshold, the Preview Window will show fewer unclassified segments. A value of 0 means that all segments will be classified.