Use Matched Filtering (MF) to find the abundances of user-defined endmembers using a partial unmixing. This technique maximizes the response of the known endmember and suppresses the response of the composite unknown background, thus matching the known signature. It provides a rapid means of detecting specific materials based on matches to library or image endmember spectra and does not require knowledge of all the endmembers within an image scene. This technique may find some false positives for rare materials. See Spectral Tools References and Matched Filtering Results for additional information.
Note: You can use MTMF to reduce the number of false positives.
You can write a script to performed Matched Filtering using the MatchedFilter task.
- From the Toolbox, select Spectral > Mapping Methods > Matched Filtering. The Matched Filter Input File dialog appears.
- Select the input file and perform optional spatial and spectral subsetting, and/or masking, then click OK.
- Click OK. The Endmember Collection:Matched Filter dialog appears.
- Import the spectra to match. See Import Spectra for details.
- Click Apply. The Matched Filter Parameters dialog appears.
- Use the toggle button to select Compute New Covariance Stats and enter an output statistics filename, or toggle to Use Existing Stats File.
- If you selected Compute New Covariance Stats: To remove anomalous pixels before calculating background statistics, enable the Subspace Background check box. Then, specify in the Background Threshold field the fraction of the background in the anomalous image to use for calculating the subspace background statistics. The threshold range is 0.500 to 1.000 (the entire image).
- Select output to File or Memory.
- From the Output Data Type drop-down list, select Byte or Floating Point.
- If you select Byte, enter a Min and Max stretch value.
- Click OK. If you selected Use Existing Stats File, select the statistics file that corresponds to the input data file when the Input File dialog appears. This statistics file must contain both the mean and covariance statistics for the input data.
Matched Filtering Results
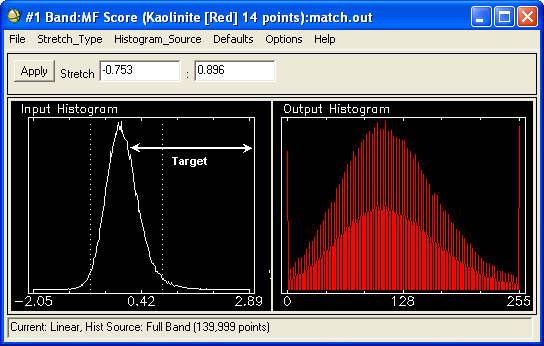
The results of MF appear as a series of gray scale images, one for each selected endmember. Floating-point results provide a means of estimating the relative degree of match to the reference spectrum and approximate sub-pixel abundance, where 1.0 is a perfect match.
You should stretch each image.
If you selected byte data type output, use the data in the upper tail of the histogram for the stretch.
The data histogram of the background material is centered around 0, and the target (endmember) appears in the upper tail of the histogram (see the figure below). Therefore, the data in the upper tail of the histogram should be stretched from about 0.1 to about 0.65 to show only pixels containing the target material. Image values in the symmetric histogram distribution centered on 0 are background areas.
Note: You can set a default stretch range so that you do not have to stretch the data each time they are displayed.
