This topic describes how ENVI computes various stretch types. See the following sections:
Bipolar Stretch
If the data does not include both positive and negative values, this stretch will have no effect. ENVI computes this stretch as follows:
- Determines the positive pixel values at the 2% and 98% location in the histogram.
- Computes the absolute value of the most positive pixel value. In the following example it is 306.
- Determines the negative pixel values at the 2% and 98% location in the histogram.
- Computes the absolute value of the most negative pixel value. In the following example it is 313.
- Selects the greatest absolute value between the two and assigns that value to both ends of the histogram. In this example, the greatest absolute value is 313 so the stretch ranges from -313 to 313.
Equalization Stretch
ENVI applies a histogram equalization stretch, which scales the data to have the same number of digital numbers (DNs) in each display histogram bin.
Gaussian Stretch
ENVI performs the following steps:
- Sets the data mean value to a screen value of 127.
- Sets the data value that is three standard deviations below the mean value to a screen value of 0.
- Sets the data value that is three standard deviations above the mean value to a screen value of 255.
Intermediate values are assigned screen values using a Gaussian curve.
Linear Percent Stretch
A linear percent stretch allows you to trim extreme values from both ends of the histogram using a specified percentage. For example, assume that the pixel values in an image range from 164 to 1908. If you select a 2% linear stretch, the lowest 2% of histogram values are less than 179 and the highest 2% are greater than 698. Values less than 179 are set to 0, and values greater than 698 are set to 255. Values in between are distributed from 0 to 255.
Linear Stretch
With a simple linear stretch, the minimum and maximum histogram values define the dynamic range of the image. You can set these values by clicking the Histogram Stretch button in the main toolbar. When you adjust these two points, pixel values greater than the maximum histogram value are assigned a value of 255. Pixel values less than the minimum histogram value are assigned a value of 0. Pixel values between these points are linearly stretched. By distributing pixel values across the entire histogram range, the image becomes brighter and more contrasted.
Logarithmic Stretch
ENVI logarithmically stretches the grayscale of the input image. This is a non-linear technique where the low-range brightness is enhanced. The logarithmic stretch is useful for enhancing features lying in the darker parts of the original image.
No Stretch
No stretch is applied, with the following exception: if the data is integer and the range is 0 to 1, the image is recognized as a mask image and will be stretched from 0 to 1 to 0 to 255 so that the image displays as black and white.
Optimized Linear Stretch
An optimized linear stretch is similar to a linear stretch but provides more settings to control midtones, shadows, and highlights in an image. It computes the stretch minimum and maximum based on four values:
- Min Percent: The default value is 0.025.
- Max Percent: The default value is 0.99.
- Min Adjust Percent: The default value is 0.1.
- Max Adjust Percent: The default value is 0.5.
ENVI creates an optimized linear stretch as follows:
- Computes a relative cumulative histogram from the data.
- Finds the data values that correspond to the Min Percent and Max Percent in the relative cumulative histogram, and labels them a and b, respectively. Most of the pixels will have data values that fall in the mid-tone range of a to b.
- Computes the black point (c) by decreasing a by the Min Adjust Percent, as follows:
c = a - 0.1 * (b - a)
- Computes the white point (d) by increasing b by the Max Adjust Percent, as follows:
d = b + 0.5 * (b - a)
- Pixel values greater than the maximum value are assigned a value of 255. Pixel values less than the minimum valueare assigned a value of 0. Pixel values between the minimum and maximum are linearly stretched.
Example
The following plot shows data points a and b in a relative cumulative histogram, computed from Band 2 of qb_boulder_msi.dat, which is included with the ENVI software installation:
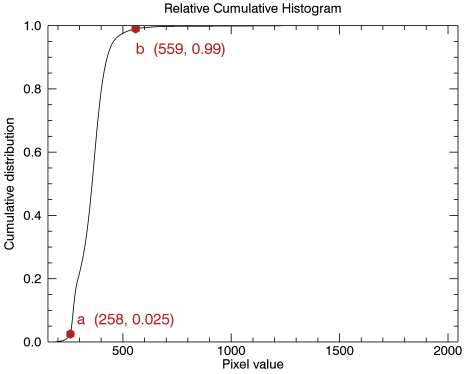
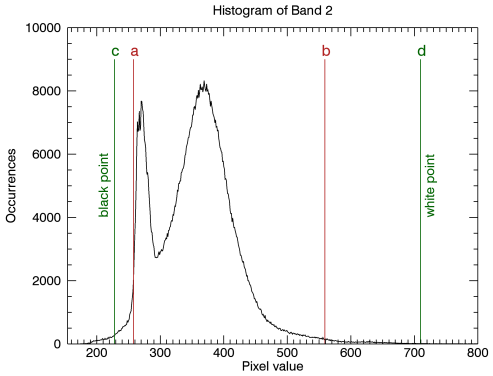
The Min Percent value of 0.025 corresponds to a pixel value of 258 in this histogram. The Max Percent value of 0.99 corresponds to a pixel value of 559.
The following histogram of Band 2 (with pixel values above 800 omitted for clarity) shows the locations of the black and white points.
Square Root Stretch
ENVI calculates the square root of the input histogram and applies a linear stretch.
See Also
Histogram Stretch, ENVIEqualizationStretchRaster, ENVIGaussianStretchRaster, ENVILinearPercentStretchRaster, ENVILinearRangeStretchRaster, ENVILogStretchRaster, ENVIOptimizedLinearStretchRaster, ENVIRootStretchRaster