Tutorial: Crop Counting and Metrics Tutorial
Use the Calculate Crop Metrics tool to calculate statistics for individual crops from a single-band image and a crop file created with the Count Crops tool. It creates a classification image showing the relative pattern of a selected crop metric, or a grayscale image showing actual values of a selected crop metric. For example, if the input image is a vegetation index such as NDVI, the metrics would describe the health of the crops.
This tool is best used with high-resolution imagery from an unmanned aerial vehicle (UAV) or other airborne sensor.
You can also use the Calculate Crop Metrics with Spectral Index tool to create spectral index images and to calculate various crop metrics from them.
This tool requires a separate license for the ENVI Crop Science Module; contact your sales representative for more information.
You can also write a script to calculate crop metrics using the ENVIAgCalculateCropMetrics function.
See the following sections:
Before You Begin
Run the Count Crops tool before using Calculate Crop Metrics. See the Enhance Crops and Count Crops topics for guidelines on preprocessing your imagery, including instructions to create a single-band image that highlights crops against a dark background. Be sure to specify an Output Crops File in the Count Crops tool.
Calculate Crop Metrics
Follow these steps to run the Calculate Crop Metrics tool:
- From the Toolbox, select Crop Science > Calculate Crop Metrics. The Calculate and Rasterize Crop Metrics dialog appears.
- Select a single-band Input Raster such as a spectral index image, an elevation image, or an image that you created from the Count Crops tool.
- Select an Input Crops file (.json) that you created using the Count Crops tool.
- Select the specific metric to calculate from the Output Metric drop-down list. The choices are:
- Crop Minimum
- Crop Maximum
- Crop Mean (default)
- Crop Standard Deviation
- Radius
- Set Create Classification Raster to Yes if you want to create a classification raster where crops are colored according to relative metrics.
- Select an output filename and location for the Output Crops Raster.
- Select an output filename and location for the Output Crops file. This file contains crop locations and metrics, in JSON format.
-
Enable the Display result check box to display the output in the view when processing is complete. Otherwise, if the check box is disabled, the result can be loaded from the Data Manager.
-
To see a model-based version of this tool that shows how the tool is constructed from individual tasks, click Open in Modeler.
-
To reuse these task settings in future ENVI sessions, save them to a file. Click the down arrow next to the OK button and select Save Parameter Values, then specify the path and filename to save to. Note that some parameter types, such as rasters, vectors, and ROIs, will not be saved with the file. To apply the saved task settings, click the down arrow  and select Restore Parameter Values, then select the file where you previously stored your settings.
-
To run the process in the background, click the down arrow next to the OK button and select Run Task in the Background. If an ENVI Server has been set up on the network, the Run Task on remote ENVI Server name is also available. The ENVI Server Job Console will show the progress of the job and will provide a link to display the result when processing is complete. See ENVI Servers for more information.
- Click OK.
Interpret the Results
If you set the Create Classification Raster option to No, the output image is a grayscale representation of the crop metric values. The following image shows an example:
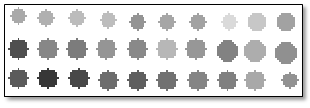
To see the metric value of each crop, click the Cursor Value button  in the main toolbar and click on a crop. You can also set any Status Bar segment to display Raster Data Values. The Status Bar displays the metric values as you move the cursor over the crops.
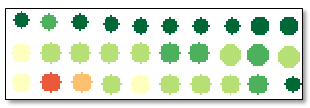
If you set the Create Classification Raster option to Yes, the output image is a classification raster where crops are colored according to relative metric values. For example, a dark green polygon corresponds to a crop with a higher value than light-green, yellow, and red polygons. The following image shows an example:
Examples
Relative Crop Health of Citrus Trees
This example shows how you can use a classification image from the Calculate Crop Metrics tool to look for patterns of unhealthy vegetation in a single field. The area of interest contains citrus trees in southern California.
The example uses four-band High-Resolution Orthoimagery from the U.S. Geological Survey (0.5-foot spatial resolution) to demonstrate the use of the Calculate Crop Metrics tool. More likely, you would use high-resolution multispectral imagery from an unmanned aerial vehicle (UAV) or other airborne sensor.
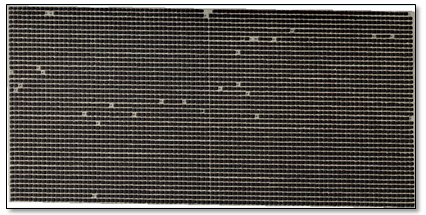
The following is a true-color image of the scene at full (100%) resolution:
A Green Difference Vegetation Index (GDVI) image was created to highlight the tree canopies.
With some experimentation, the following parameter values ultimately produced the most accurate results in the Count Crops tool:
Input Raster: The GDVI image
Minimum Crop Diameter: 2 meters
Maximum Crop Diameter: 6 meters
Number of Increments: 9
Gaussian Smoothing Factor: 0
Include Edges: No
Allowable Crop Overlap: 90%
Intensity Threshold: 0
Fill Raster Crops: Yes
An Output Crops File (.json) was also created.
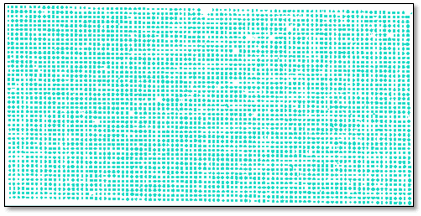
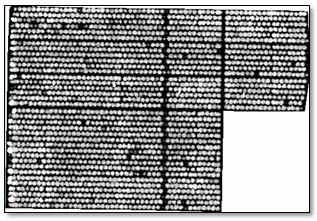
Here is the result of the Crops class (with a total count of 4,101 crops) derived from the GDVI image.
Here are the selections used in the Calculate Crop Metrics tool:
Input Raster: The Green Difference Vegetation Index (GDVI) image
Input Crops: The crop file (.json) saved from the Count Crops tool
Output Metric: Crop Mean
Create Classification Raster: Yes
The resulting classification image shows the relative health of the crops, using the GDVI as the basis for the crop metrics. The classification image overlays the original RGB orthophoto:
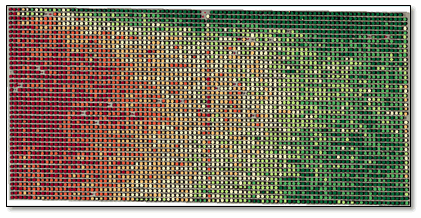
From this image, you can see that the citrus trees on the western side of the image are less healthy, while the trees to the east are progressively healthier. The pattern reveals the possibility of sprayed pesticides blowing to the east from an adjacent field.
Height of Citrus Trees
You do not have to use spectral indices as the basis for calculating crop metrics. This example shows how you can use elevation data to calculate the height of individual citrus trees. If dense point cloud data are available, this is a good way to assess different development stages in tall crops such as corn, sugarcane, or fruit-bearing trees.
This example uses Geiger-Mode LiDAR data, available from MapMart. The area of interest includes a fruit orchard near Fillmore, California. The average point density for this dataset is 20 points per square meter.
The ENVI LiDAR application was used to process the point clouds and to create a digital elevation model (DEM) and digital surface model (DSM), both with a spatial resolution of 0.5 meters. The ENVI Band Math tool was used to subtract the DEM from the DSM, to create a canopy height image:
With some experimentation, the following parameter values ultimately produced the most accurate results in the Count Crops tool:
Input Raster: The canopy height image
Minimum Crop Diameter: 1 meter
Maximum Crop Diameter: 6 meters
Number of Increments: 12
Gaussian Smoothing Factor: 0.2
Include Edges: No
Allowable Crop Overlap: 50%
Intensity Threshold: 0.1
Fill Raster Crops: Yes
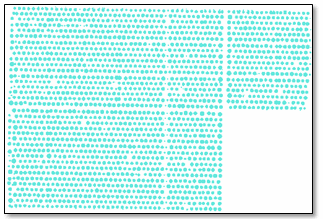
An Output Crops File (.json) was also created. Here is the result of the Crops class (with a total count of 2,014 crops) derived from the canopy height image:
Here are the selections used in the Calculate Crop Metrics tool:
Input Raster: The canopy height model (CHM) image
Input Crops: The crop file (.json) saved from the Count Crops tool
Output Metric: Crop Maximum
Create Classification Raster: No
By setting Create Classification Raster to No, the resulting image is a grayscale representation of the maximum tree heights. Darker crops represent lower maximum height values, and lighter crops represent higher maximum height values. You can view the maximum height values by using the Cursor Value tool, or by setting any Status Bar segment to Raster Data Values (as this example shows).
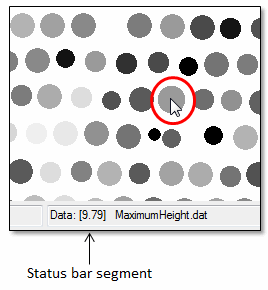
As you move the cursor over a crop location, the Status Bar shows the maximum height. In the above figure, the selected crop is 8 feet tall. The units depend on the map projection of the input raster. In this case, the projection is California State Plane Zone 5 (NAD83) in U.S. Survey Feet.
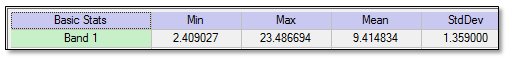
To see the range of height values in the entire image, right-click on the crop metrics image in the Layer Manager and select Quick Stats. Look for the Min and Max values under the Basic Stats column; for example:
See Also
Calculate Crop Metrics with Spectral Index, Count Crops, Enhance Crops