By default, an OR logical operation is used to combine multiple rules within a class, while an AND operator is used to combine multiple attributes within a rule. This logic works well for building rules in most cases. But you may want to override the default behavior, for example, when you are confident that one rule effectively identifies your feature of interest and you want to promote that rule over the others.
You can do this by experimenting with different weight, score, and threshold fields, which are used in combination to assign pixels to classes. By entering your own values to these fields, you will override the default OR/AND logic.
This topic explains each of these fields and how they are used.
Assigning Pixels to Classes
In rule classification, a class contains one or more rules. Each rule contains one or more attribute definitions. Each class has a score that is defined as follows:

The Rule Score is defined as follows:

See Attribute Score and Attribute Weight for more information on these two values.
The default value for Rule Weight is 1 for each rule within a class; it displays in the Rule Properties table when you select a rule name. Since multiple rules for a class are combined with an OR logical operator, each rule is equally weighted.
The computed Class Score is compared to a Class Threshold value for that class. The Class Threshold is computed as follows:
The Class Threshold value displays in the Class Properties table when you select a class name, and it also appears next to the class name. It is automatically computed each time you add attributes to any rule. You can change its value as needed to improve classification results, but you should wait until you have added all rules and attributes. If you add more attributes later, the Class Threshold will automatically update and override your entry.
If the Class Score exceeds the threshold, then the segment is assigned to the class. If there are multiple classes with thresholds that have been exceeded, then the segment is assigned to the class where the threshold was exceeded by the largest value.
Attribute Score
An attribute score indicates the likelihood of a segment satisfying the condition of an attribute (for example, Area > 500). The score ranges from 0 to 1.
ENVI computes the attribute score by first creating a cumulative distribution function (CDF) from the histogram of attribute values. When you select a range of attribute values in the Rule Classification panel, that range is mapped to the CDF curve, along with the Tolerance value that you specify. The new minimum and maximum attribute values are mapped to a classification curve. Depending on where the attribute values fall on the classification curve, pixels are excluded from consideration for that attribute (a score of 0), included (a score of 1), or assigned a score in between 0 and 1.
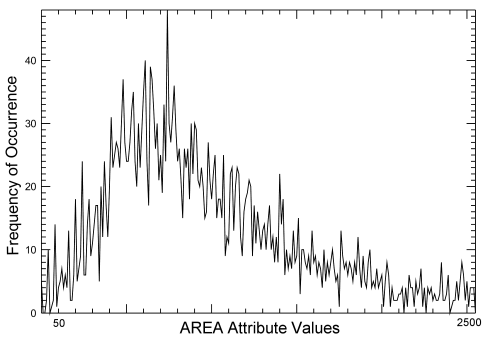
The following is a sample histogram of Area attribute values in a segmentation image. The Area values range from approximately 25 to 2600.
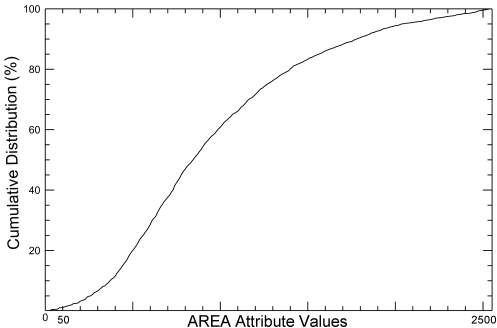
A cumulative distribution curve is computed from the histogram:
Suppose you limit the Area attribute to values greater than 500 in the Rule Classification panel:
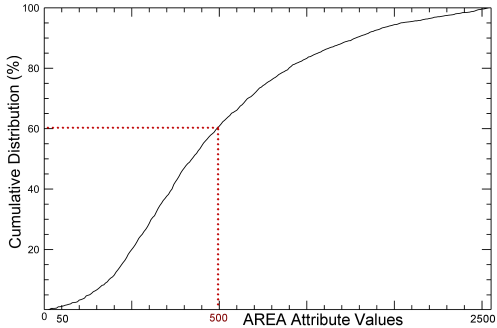
From this curve, you can see that 60% of the pixels in the segmentation image have Area values less than or equal to 500.
If you selected Binary from the Algorithm drop-down list, then Area attribute values less than 500 are assigned an attribute score of 0. Attribute values greater than or equal to 500 are assigned an attribute score of 1.
If you selected Linear or Quadratic from the Algorithm drop-down list, you need to specify a Tolerance value (%). The default value is 5.0 or 5%. The larger the Tolerance value you specify, the more you allow nearby pixel clusters to be included in the attribute. For this example, assume the Tolerance is 30.0 or 30%. The tolerance is shown in the following CDF curve:
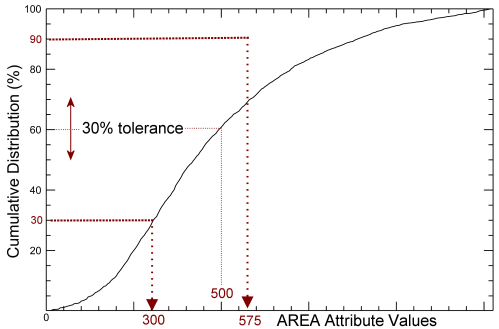
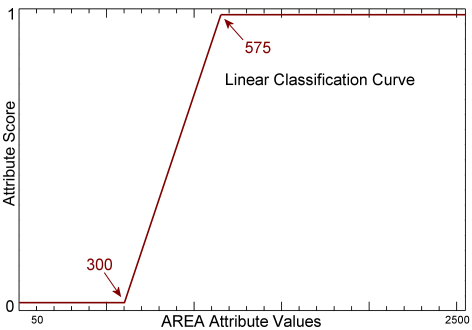
The range of attribute values (300 to 575) is applied to a Linear or Quadratic classification curve, depending on which option you selected.
For the linear curve, Area values less than 300 are assigned a score of 0. Values greater than or equal to 575 are assigned a score of 1. Values in between 300 and 575 are assigned an attribute score between 0 and 1, depending on where the value falls in on the linear classification curve:
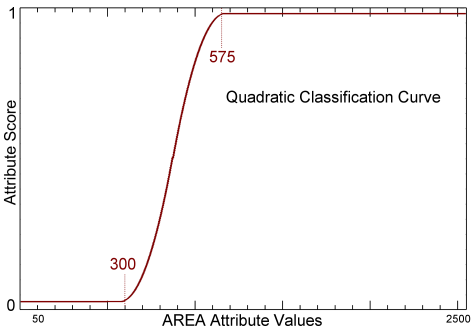
Attribute scores are similarly determined for the quadratic curve:
Once the attribute scores are determined, they are multiplied by the Weight value that you define (in the Rule Classification panel for a given attribute) to compute the Rule Score.
Attribute Weight
When you select an attribute in the Rule-based Classification panel and click the Advanced tab, the Weight value is shown for that attribute. Since multiple attributes within a rule are combined with an AND logical operator, the Weight values add up to 1 by default. For example, if you have four attributes within a rule, the Weight value for each attribute is 0.25. You can assign a higher Weight value to an attribute if you are confident that it identifies your feature of interest and you want to promote its rule over other rules. In this case, you will override the default OR/AND logic among rules and attributes.
The weights automatically update as you add or remove attributes. You can assign a different Weight to an attribute, but you should wait until you have defined all of the attributes for that rule before changing the value.