Use the Material Identification tool to compare an unknown spectrum with the known spectra of a spectral library and rank the similarity between the two using common spectral similarity algorithms.
The spectral library spectra are resampled into the wavelength range of the input spectrum so they can be compared; therefore, the two must contain overlapping wavelength ranges for the comparison to work.
Material Identification uses these algorithms when comparing the source spectrum to each spectrum in the spectral library:
When run from the Spectral Profile (where an input raster is available), Material Identification runs these algorithms in addition to those above:
To use the tool:
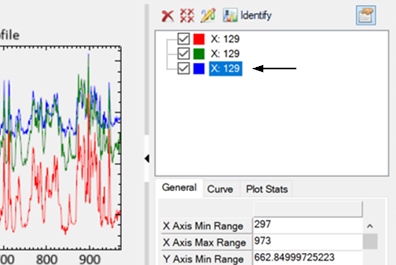
The Identify button  is located in the expanded plot properties panel of any profile or plot window, and also in the main window of the Spectral Profile. Start the Material Identification process with one of the following:
-
From the Spectral Profile window, click the Identify button in the main window. Or, expand the plot properties panel of the window and click the Identify button at the top of the panel.
-
From all other plots and profiles, expand the plot properties panel of the window, select the plot to run material identification on in the plot Key, then click the Identify button.
Processing takes approximately 30 seconds to run, then the Material Identification result window appears, showing ranked results. At the top of the window, the current spectral library (the one used for the comparison) and the name of the current input spectrum are listed. The image below includes results for all five algorithms since it was run from the Spectral Profile window. If run from other plot or profile windows, you would see columns for only SAM, SID, and ED:
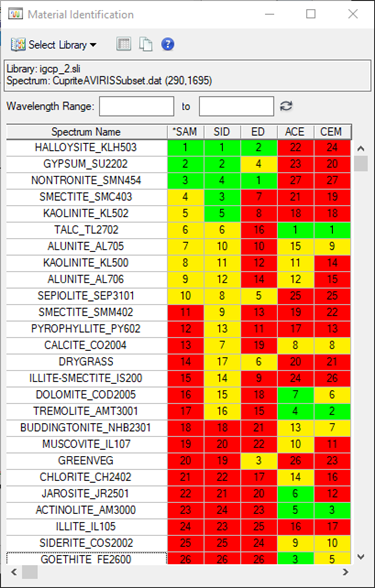
The results are grouped by the names of all the spectra in the current library. You can click on a column name to sort the data by that column.
The closest match is ranked with a value of 1.
-
All remaining spectra are ranked from 2 up to the number of spectra in the library.
-
Green means the sample was within 10% of the normalized best score.
-
Yellow means the sample was within 25% of the normalized best score.
-
Red means the sample was not within 25% of the normalized best score.
Having a rank of “1” does not guarantee that the spectrum from the spectral library is an accurate match with the source spectrum; it only means that of all the spectra in the library, that particular spectrum was closest.
Note: The algorithms use different criteria for determining what a close match is. For example: with SAM the smaller the SAM angle, the closer the match is; with ACE and CEM the higher the score, the closer the match is.
ENVI uses igcp_2.sli as the default spectral library when you first run Material Identification. You can select other spectral libraries for comparison through the Material Identification window:
-
To choose another library available from the INSTALL_DIR\resource\speclib folder, use the Select Library drop-down list.
-
To use your own spectral library, select Select Library > Open Spectral Library and navigate to the file.
When using the Spectral Profile you can change the pixel selected in the View, and both the Spectral Profile window and the Material Identification results window automatically update to reflect the current pixel. For all other plots and profiles this remains static; Material Identification is applied only to the plot you selected in the Key.
Additional options in the Material Identification window:
-
Click on a row in the window to plot the selected spectrum in the same plot window as the source spectrum for comparison. Click the Clear Selection button  to clear the selected row
-
Enter Wavelength Range values in the fields provided to change the wavelength range used to compare the spectra. By default, the full range of the input spectrum is used. Click the Reset Wavelength Range button  to return to using the full range.
-
Click the Copy result to clipboard button to copy the current table to the Windows copy buffer so that the results can be pasted into another application.