Use the Confusion Matrix Using Ground Truth Image and Confusion Matrix Using Ground Truth ROIs tools to calculate confusion matrices and accuracy metrics.
You can also write a script to calculate confusion matrices and accuracy metrics using the ENVIConfusionMatrix routine.
See the following sections:
Use a Ground Truth Image
When using a ground truth image, you can also calculate error mask images for each class showing which pixels were incorrectly classified.
Note: The ground truth image and input image must have the same X and Y dimensions, pixel sizes, and spatial reference so that their pixels exactly align.
- From the Toolbox, select Classification > Post Classification > Confusion Matrix Using Ground Truth Image. The Classification Input File dialog appears.
- Select an input file and perform optional spatial and spectral subsetting, then click OK. The Input File dialog appears. The Ground Truth Input File dialog appears.
- Select the ground truth image and perform any spatial subsetting, then click OK. The Match Classes Parameters dialog appears.
-
Match the ground truth classes with the classification result classes by selecting the matching names in the two lists and clicking Add Combination. The class combinations are shown in a list at the bottom of the dialog. If the ground truth and classification classes have the same names, they are automatically matched.
To remove a class match from the list, select the combination name. The two class names reappear in the lists at the top of the dialog.
- Click OK. The Confusion Matrix Parameters dialog appears.
- Next to the Output Confusion Matrix in label, select the Pixels and/or the Percent check boxes. If you select both check boxes, they will be reported in the same window.
- Next to the Report Accuracy Assessment label, select the Yes or No toggle.
-
Next to Output Error Images label, click the toggle button to select Yes or No.
The output error images are mask images, one for each class, where all correctly classified pixels have a value of 0 and incorrectly classified pixels have a value of 1. The last error image band shows all the incorrectly classified pixels for all the classes combined.
- Select output to File or Memory. If File is selected, enter an output filename.
-
Click OK.
The items in the report are described in Confusion Matrix Example below.
Use Ground Truth Regions of Interest
You can display a confusion matrix using ROIs for ground truth. This report pairs ROIs with the classes of a classification image to show what percentage of the ROI pixels were or were not contained in a resulting class. To display a confusion matrix report using ROIs for ground truth:
- From the Toolbox, select Classification > Post Classification > Confusion Matrix Using Ground Truth ROIs. The Classification Input File dialog appears.
- Select a classification input file and perform optional spatial and spectral subsetting, then click OK. The Ground Truth Input File dialog appears. The Match Classes Parameters dialog appears.
-
Match the ground truth ROIs with the classification result classes by selecting the matching names in the two lists and clicking Add Combination. The class combinations are shown in a list at the bottom of the dialog. If the ground truth and classification classes have the same names, they are automatically matched.
To remove a class match from the list, select the combination name. The two class names reappear in the lists at the top of the dialog.
- Click OK. The Confusion Matrix Parameters dialog appears.
- Select the Pixels and/or the Percent check boxes.
- Click the Yes or No toggle for Report Accuracy Assessment, and click OK.
The items in the report are described in Confusion Matrix Example below.
Confusion Matrix Example
In an ENVI confusion matrix, columns represent true classes, while rows represent the classifier's predictions. The matrix is square, with all correct classifications along the upper-left to lower-right diagonal.
Here are some examples of how to read this matrix:
- 2,385 values were correctly classified as Asphalt.
- Reading down the Concrete column, 4 values that should have been Concrete were classified as Asphalt, and 1 value was classified as Grass. These are omission errors, which are defined as the fraction of values that belong to a class but were predicted to be in a different class. Errors of omission represent false negatives.
- Reading across the Concrete row, 1 value that should have been Building was classified as Concrete. This is a commission error, which is defined as the fraction of values that were predicted to be in a class but do not belong to that class. Errors of commission represent false positives.
This confusion matrix example is based on the number of pixels. ENVI also calculates a separate confusion matrix with percentage values.
The following accuracy metrics are also reported:
Overall Accuracy
The overall accuracy is calculated by summing the number of correctly classified values and dividing by the total number of values. The correctly classified values are located along the upper-left to lower-right diagonal of the confusion matrix. The total number of values is the number of values in either the truth or predicted-value arrays.
In the example confusion matrix, the overall accuracy is computed as follows:
Correctly classified values: 2385 + 332 + 908 + 1084 + 2053 = 6762
Total number of values: 6808
Overall accuracy: 6762 / 6808 = 0.993243
Kappa Coefficient
The kappa coefficient measures the agreement between classification and truth values. A kappa value of 1 represents perfect agreement, while a value of 0 represents no agreement. The kappa coefficient is computed as follows:
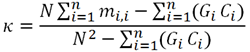
Where :
- i is the class number
- N is the total number of classified values compared to truth values
- mi,i is the number of values belonging to the truth class i that have also been classified as class i (i.e., values found along the diagonal of the confusion matrix)
- Ci is the total number of predicted values belonging to class i
- Gi is the total number of truth values belonging to class i
In the example confusion matrix, the kappa coefficient is 0.990839.
Errors of Commission
Errors of commission represent the fraction of values that were predicted to be in a class but do not belong to that class. They are a measure of false positives. Errors of commission are shown in the rows of the confusion matrix, except for the values along the diagonal.
In the example confusion matrix, the errors of commission are computed as follows:
Asphalt: (4 + 0 + 1 + 4) / 2394 = 0.0038
Concrete: (0 + 0 + 0 + 1) / 333 = 0.0030
Grass: (0 + 1 + 8 + 0) / 917 = 0.0098
Tree: (0 + 0 + 0 + 9) / 1093 = 0.0082
Building: (12 + 0 + 0 + 6) / 2071 = 0.0087
Errors of Omission
Errors of omission represent the fraction of values that belong to a class but were predicted to be in a different class. They are a measure of false negatives. Errors of omission are shown in the columns of the confusion matrix, except for the values along the main diagonal.
In the example confusion matrix, the errors of omission are computed as follows:
Asphalt: (0 + 0 + 0 + 12) / 2397 = 0.0050
Concrete: (4 + 1 + 0 + 0) / 337 = 0.0148
Grass: (0 + 0 + 0 + 0) / 908 = 0.000
Tree: (1 + 0 + 8 + 6) / 1099 = 0.0136
Building: (4 + 1 + 0 + 9) / 2067 = 0.0068
Producer Accuracy
Producer accuracy is the probability that a value in a given class was classified correctly. In the example confusion matrix, producer accuracy is computed as follows:
Asphalt: 2385 / 2397 = 0.995
Concrete: 332 / 337 = 0.985
Grass: 908 / 908 = 1.0
Tree: 1084 / 1099 = 0.986
Building: 2053 / 2067 = 0.993
User Accuracy
User accuracy is the probability that a value predicted to be in a certain class really is that class. The probability is based on the fraction of correctly predicted values to the total number of values predicted to be in a class.
In the example confusion matrix, user accuracy is computed as follows:
Asphalt: 2385 / 2394 = 0.996
Concrete: 332 / 333 = 0.997
Grass: 908 / 917 = 0.99
Tree: 1084 / 1093 = 0.992
Building: 2053 / 2071 = 0.991