Use the Calculate Zone Metrics tool to create a spectral index image and to calculate statistics from it and an associated zones object (created with the Create Zones tool). It creates a classification image showing the relative statistics of the zones, or a grayscale image showing the actual statistical values of the zones.
This tool requires a separate license for the ENVI Crop Science Module; contact your sales representative for more information.
You can also write a script to create management zones using AgCalculateAndRasterizeZoneMetrics task.
See the following sections:
Before You Begin
Before calculating zone metrics, run the Create Zones tool and specify an Output Zones file (in .sav format).
Calculate Zone Metrics
Follow these steps:
- From the Toolbox, select Crop Science > Calculate Zone Metrics. The Calculate and Rasterize Zone Metrics dialog appears.
- Select a single-band Input Raster. It can be the same image used as input to the Create Zones tool, or it can be a different image (for example, a vegetation index) as long as it overlaps.
- Select an Input Zones object (.sav) that was created from the Create Zones tool.
- Optional: Select an Input Zone Raster if it is available. This is a classification image that corresponds to the input zones. This allows zone metrics to be calculated faster for large images.
- Select the metric to calculate from the Output Metric drop-down list. The choices are:
- Zone Minimum
- Zone Maximum
- Zone Mean (default)
- Zone Standard Deviation
- Set Create Classification Raster to Yes if you want to create a classification raster where zones are colored according to relative metrics. This is a good option if the input image is a spectral index image such as Normalized Difference Vegetation Index (NDVI); in this case, the classification image could be used to assess the relative health of the different zones. If you set Create Classification Raster to No, the result is a grayscale image of mean values for each zone. See the Example below.
- Select an output filename and location for the Output Zones Raster.
- Select an output filename and location for the Output Zones. This will be a new zones object in IDL save format (.sav) with the metric added.
-
Enable the Display result check box to display the output in the view when processing is complete. Otherwise, if the check box is disabled, the result can be loaded from the Data Manager.
-
To see a model-based version of this tool that shows how the tool is constructed from individual tasks, click Open in Modeler.
-
To reuse these task settings in future ENVI sessions, save them to a file. Click the down arrow next to the OK button and select Save Parameter Values, then specify the path and filename to save to. Note that some parameter types, such as rasters, vectors, and ROIs, will not be saved with the file. To apply the saved task settings, click the down arrow  and select Restore Parameter Values, then select the file where you previously stored your settings.
-
To run the process in the background, click the down arrow next to the OK button and select Run Task in the Background. If an ENVI Server has been set up on the network, the Run Task on remote ENVI Server name is also available. The ENVI Server Job Console will show the progress of the job and will provide a link to display the result when processing is complete. See ENVI Servers for more information.
- Click OK.
Example
The following example uses a DEM as the basis for splitting a field into management zones. The ENVI LiDAR application was used to process point-cloud data (courtesy of the U.S. Geological Survey) into a stratified DEM with 2-meter spatial resolution. A region of interest (ROI) was drawn around a field of interest, excluding buildings. The DEM was masked and subsetted using the ROI boundary, so that the DEM covered the extent of the corn field:
Tip: This DEM (FieldDEM.dat) is available in INSTALL_DIR\ENVIxx\data\crop_science\.
Follow these steps to run the example:
- From the ENVI Toolbox, select Crop Science > Create Zones.
- Enter the following values in the Create Zones dialog:
- Input Raster: Select FieldDEM.dat.
- Number of Application Categories: 5
- Minimum Area: 2023 square meters (1/2 acre)
- Maximum Area: (Leave blank)
- Primary Angle: 0 degrees
- Output Classification Raster: AgCreateZones.dat
- OutputZones: AgCreateZones.sav
- Uncheck the Preview and Display result options.
- Click OK.
- From the ENVI Toolbox, select Crop Science > Calculate Zone Metrics. The Calculate and Rasterize Zone Metrics dialog appears.
- In the Input Raster field, select FieldDEM.dat.
- In the Input Zones field, select AgCreateZones.sav.
- From the Output Metric drop-down list, select Zone Mean.
- Select the No option for Create Classification Raster.
- In the Output Zones Raster field, browse to a desired location to save the output raster, and accept the default filename of AgCalculateAndRasterizeZoneMetrics.dat.
- In the Output Zones field, browse to a desired location to save the output zones object, and accept the default filename of AgCalculateAndRasterizeZoneMetric.sav.
- Select the Display result option.
- Click OK.
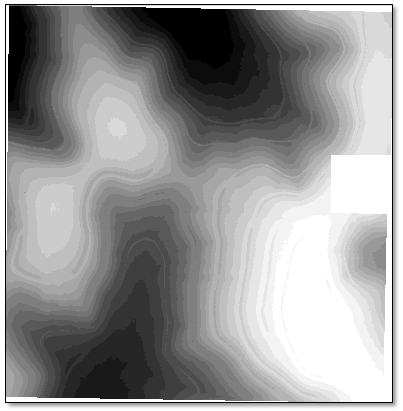
The resulting image is a grayscale representation of mean elevation values for each zone. Darker zones represent lower elevations, and lighter zones represent higher elevations.
You can view the actual pixel values of each zone by using the Cursor Value tool  , or by setting any Status Bar segment to Raster Data Values (as this example shows).
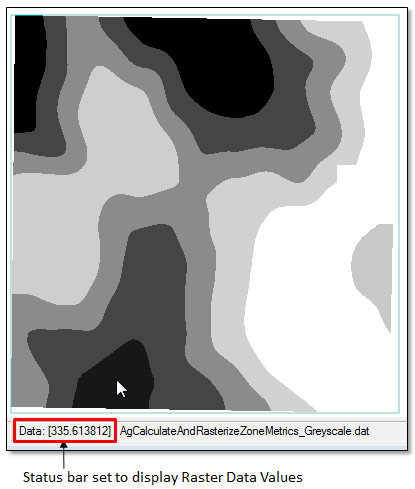
As you move the cursor over a zone, the Status Bar shows the mean value (or whatever statistic you choose in the Output Metric drop-down list). In the above figure, the mean elevation of the black zone is 335.62 meters.
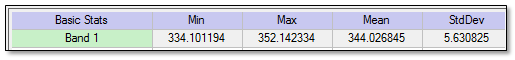
To see the range of zone values in the entire image, right-click on the zone metrics image in the Layer Manager and select Quick Stats. Look for the Min and Max values under the Basic Stats column; for example:
One way that you could extend this example is to create an NDVI image from a multispectral or hyperspectral image of the study area, then overlay it on the mean zones image. Then you could determine if healthier plants correspond to higher or lower elevations. See Calculate Zone Metrics with Spectral Index for an example that is similar to this.
See Also
Create Zones, Calculate Zone Metrics with Spectral Index, Convert Zones to Shapefile