Region of Interest (ROI) Tool
Regions of Interest (ROIs) are selected samples of a raster, such as areas of water, that are identified for a particular purpose. You can use ROIs for processing in some ENVI tools, such as to extract statistics for classification. To create and manage ROIs, click the Region of Interest (ROI) Tool button  on the toolbar. When you define an ROI, you specify the pixels of an image that will be in or out of the ROI. For more information on the rules that determine when a pixel is included in an ROI, see the ROI Pixel Inclusion Background topic.
ENVI performs a real-time orthorectification for ROI layers created on top of an RPC image. The ROI layers will contain projected coordinates that can display with other projected imagery, and projected ROI layers will display on top of an existing RPC image without reprojecting the RPC image.
The following are described in this section:
Create ROIs from Geometry
To create ROIs from geometry, draw shapes or mark points on the raster layer. You can also create multi-part ROIs, which are polygon, rectangle, or ellipse shapes that contain holes.
- In the Region of Interest (ROI) Tool, click the New ROI button
 on the toolbar. In the Layer Manager, the selected raster in the Layer Manager becomes the parent to the new ROI layer that is added below it.
- Select the Geometry tab.
- Click the Polygon, Rectangle, Ellipse, Polyline, or Point button. An ROI can contain any combination of these geometry.
- By default, vertices do not snap as you draw ROIs. To snap vertices, enable the Vertex Snap check box.
-
Create ROIs in the Image window as follows:
- Polygon or Polyline ROIs: Click to mark the vertices of the polygon or polyline, or click and drag to draw the shape. To complete the shape, press the Enter key once, or right-click and select Complete shape_type. Until you "accept" the shape, it appears translucent and you can edit its size or vertices, or move it.
- Rectangle or Ellipse ROIs: Click and drag to draw the rectangle or ellipse. Until you "accept" the shape, it appears translucent and you can edit its size or vertices, move it, or rotate it.
- Point ROIs: Click to mark points. Until you "accept" the points, they appear as crosshairs.
When adding any shape or point, you can press the Delete key to clear it, or right-click and select Clear shape_type. For polygons or polylines, press the Backspace key to delete the last vertex drawn.
With polygons, you can use a shortcut to draw a rectangle at an angle: Click two vertices to define one side of the rectangle. These two points determine the angle at which the rectangle will be drawn. Press and hold the Shift key and drag the previewed rectangle to the end of the object. Click the mouse when you are ready to accept the rectangle.
You can also rotate a ROI as follows: Draw a shape, then right-click in the view and select Complete shape type. Move the cursor near the center handle and click the Shift key. A rotation icon appears (see the circled icon in the figure below). Click and drag to rotate the object as needed, then release the mouse key.
- Press the Enter key a second time to accept the shape or points, or right-click and select Accept shape type. The new ROI is added to the ROI layer, and the Record Count in the ROI Tool increments. Once accepted, a shape appears in solid color. If you marked ROIs as points, the appearance of the points changes from crosshairs to marked pixels.
- Assign an ROI Name and change the ROI Color as needed.
To create a multi-part ROI from a polygon, rectangle, or ellipse:
- In the Geometry tab, click the Polygon, Rectangle, or Ellipse button.
- Enable the Multi Part check box.
-
Draw the shape to create the first part.
- Press the Enter key twice to complete the part, or right-click and select Complete shape Part. The shape appears in a transparent color as you draw the second part on top of it to create the hole.
-
Draw the second part. The shape must be contained within the bounds of the first part.
Tip: To remove all holes from the current shape, right-click and select Remove Holes.
-
Press Enter to complete the shape, or right-click and select Complete shape Part. A hole displays in the ROI.
-
Press Enter a final time to accept and complete the multi-part, or right-click and select Accept Multi Part.
Edit Geometry ROIs
To edit geometry ROIs, click the Go To arrow buttons at the bottom of the ROI Tool to navigate the individual records of the selected ROI layer. As you click through the individual ROIs, the Image window centers over the each record. To navigate to a different ROI layer, click the Select Next ROI  button on the toolbar.
Note: Editing functions are disabled if the ROI has been reprojected onto a base image layer that has a different resolution or map information.
- To edit a record, right-click the record in the Image window and select Edit Record. Move or resize the shape by dragging the selection handles. Move vertices by dragging the circles that appear when you hover over the shape. Add a new vertex before or after a selection by pressing the keyboard keys + and -, or by right-clicking and selecting from the menu options. To accept the edits, right-click and select Accept shape type, or press the Enter key.
- To edit the size of the rectangle or ellipse before the shape is accepted, click the edges of the box and drag, or right-click on the shape and select Rectangle Size or Ellipse Size to enter exact values in the Edit Size dialog. To move the shape, click inside it and drag.
- To duplicate a record and move it to another location, right-click the record in the Image window and select Duplicate Record. Move or resize the shape by dragging the selection handles as needed. To accept the edits, right-click and select Accept shape type, or press the Enter key.
- To delete a single record, right-click the record in the Image window and select Delete Record. You can also click the Delete Record button in the ROI Tool.
- To delete all records from an ROI, select the Delete All Records button in the ROI Tool.
You can also delete a group of polygon, rectangle, or ellipse ROI records at once. Follow these steps:
- Select the Geometry tab in the Region of Interest (ROI) Tool.
- Hold down the Shift key and left mouse button simultaneously. The cursor changes to a minus symbol (-).
- Drag the cursor to draw a polygon around the ROI records that you want to remove.
- Release the left mouse button. The selected ROI records are removed.
This action cannot be undone. To abort the selection while you are drawing a polygon, click the right mouse button (while continuing to hold down the left mouse button).
Create ROIs from Pixels
To create ROIs from pixels, select pixels on the raster layer. You can select a single pixel at a time (1x1), or up to an area of 5x5 pixels at a time.
- In the ROI Tool, click the New ROI button on the toolbar. In the Layer Manager, the selected raster in the Layer Manager becomes the parent to the new ROI layer that is added below it.
- Select the Pixel tab.
- Select the Brush Size from the drop-down list. You can select 1x1, 2x2, 3x3, 4x4, 5x5, 10x10, and 25x25 pixels for the brush size.
- In the Image window, click a pixel, or click and drag to "paint" an area of pixels.
- Assign an ROI Name and change the ROI Color as needed.
Edit Pixel ROIs
To edit pixel ROIs, click the Go To arrow buttons at the bottom of the ROI Tool to navigate the individual records of the selected ROI layer. As you click through the individual ROIs, the Image window centers over the each record. To navigate to a different ROI layer, click the Select Next ROI button on the toolbar.
Note: Editing functions are disabled if the ROI has been reprojected onto a base image layer that has a different resolution or map information.
To delete an individual pixel, place the selection box cursor over the pixel. Zoom into the view if needed. Then right-click and select Delete Pixel, or press the Delete key. If you added pixels using a brush size larger than 1x1, you can also delete the pixel group as a whole, or only part of it.
To delete all pixels from an ROI, select the Delete All Pixels button in the ROI Tool.
You can also delete a group of pixel ROIs at once. Follow these steps:
- Select the Pixel tab in the Region of Interest (ROI) Tool.
- Hold down the Shift key and left mouse button simultaneously. The cursor changes to a minus symbol (-).
- Drag the cursor to draw a polygon around the pixel ROIs to remove.
- Release the left mouse button. The selected pixels are removed.
This action cannot be undone. To abort the selection while you are drawing a polygon, click the right mouse button (while continuing to hold down the left mouse button).
Grow ROI Polygons Using the Magic Wand Tool
Manually drawing polygons around complex objects such as clouds, tree crowns, and lakes can be time-consuming and labor-intensive. In these cases, you can use the Magic Wand tool to grow complex polygons from one or more "seed" pixels. Follow these steps:
- In the ROI Tool, click the New ROI button on the toolbar.
- Select the Geometry tab in the ROI Tool.
- Click the Polygon button.
- Find an object in your image whose shape you want to capture.
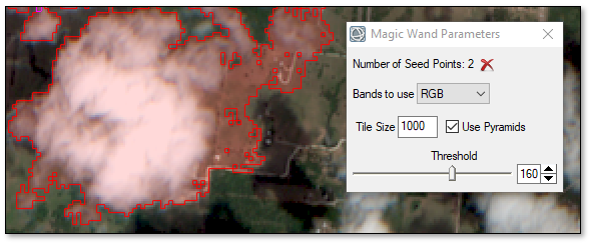
- Hold down the Ctrl key, then click on a pixel inside of the object. The Magic Wand Parameters dialog appears. ENVI grows the region around the seed pixel by including neighboring pixels that are within the specified Threshold value. Here is an example within a cloud:
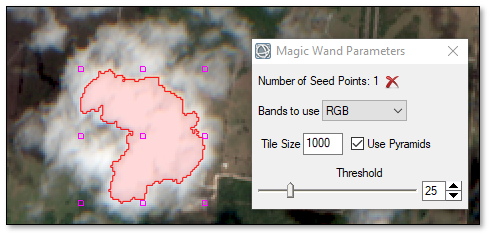
- Adjust the Threshold value to shrink or expand the current region. The range of values is 0 to 255, where 0 is the seed pixel and 255 is the entire image. The Magic Wand tool calculates thresholds based on the byte-stretched data that is displayed in the view.
- Optional: You can experiment with different Bands to use options to improve the initial polygon result. For multispectral images, the choices are: RGB (default), Red, Green, Blue, HSI, Hue, Saturation, Intensity. For single-band images, the only choice is Gray Scale.
If the size of the region exceeds the Tile Size (1000 pixels by default), and the Use Pyramids option is enabled, the Magic Wand tool will use a coarser pyramid level to grow the region. This allows large regions to be represented by a polygon but at a reduced pixel resolution; for example:
If you disable the Use Pyramids option, then the polygon will be at full pixel resolution but will only grow as large as the specified Tile Size.
- Use Ctrl-click to add more seed points within the same object to help it grow correctly. Or, add more seed points to similar objects to create a multi-part polygon. The Number of Seed Points is incremented. To remove the last seed point, click the Remove Seed Point button
 .
.
- To remove all holes inside of a polygon, right-click and select Remove Holes. This will make the polygon a solid object.
- To delete the current polygon, right-click and select Clear Multi Part or Clear Polygon.
- Once you are satisfied with the extent of the polygon, right-click and select Accept Multi Part or Accept Polygon. Here is an example result:

Grow ROIs from Neighboring Pixels
To grow ROIs from neighboring pixels, select an ROI that was previously created and set a threshold. The threshold defines the number of standard deviations away from the mean of that selected record. Use either 4 or 8 neighboring pixels to determine the growth pattern. The area to grow is calculated using the displayed band for a gray scale display, or the R,G,B bands for a color display.
- In the Geometry tab or Pixel tab of the Region of Interest (ROI) Tool, use the arrow keys to navigate to the record you want to grow.
- Select the Grow tab.
- Set the Max Growth Size in pixels. This determines the maximum size the ROI can grow to.
- Enter a value for the Std Dev Multiplier. The standard deviation multiplier sets how many standard deviations away from the mean of the drawn ROI to include in the grown ROI.
- Enter the number of Iterations to perform to grow the ROI. The higher the number of iterations, the more pixels that will be included in the final ROI.
- Enable the Eight Neighbors check box to use the eight nearest-neighbor pixels. If this check box is disabled, then only the four nearest-neighbor pixels will be used.
- Click Apply.
- Repeat this process and change the settings as needed until you achieve the desired result. To reset the ROI to its original state before you grew the ROI, click Reset.
To edit the ROIs, click the Go To arrow buttons at the bottom of the ROI Tool to navigate the individual records of the selected ROI layer. As you click through the individual ROIs, the Image window centers over the each record. To navigate to a different ROI layer, click the Select Next ROI button on the toolbar.
Note: Editing functions are disabled if the ROI has been reprojected onto a base image layer that has a different resolution or map information.
- To delete pixels, place the selection box cursor over the pixel to remove (zoom into the view, if needed), then right-click and select Delete Pixel, or press the Delete key.
- To delete all pixels from an ROI, select the Delete All Pixels button in the ROI Tool.
Create ROIs from Band Thresholds
To create ROIs from band thresholds, set specific image values or ranges of values.
You can write a script to perform this task using the ImageThresholdToROI task.
-
Do one of the following:
A new ROI is added to the Layer Manager, and the Data Selection dialog appears.
- Select a band to threshold, and click OK. The Choose Threshold Parameters dialog appears, which includes a histogram of the band. To change the selected band, click
 .
.
-
Use the Min Value and Max Value fields to define the ROI as follows:
- Enter only a Min Value to create an ROI using pixels that are greater than or equal to the value.
- Enter only a Max Value to create an ROI using pixels that are less than or equal to the value.
- Enter both minimum and maximum values to create an ROI using pixels that fall within the specified range.
You can also use the histogram to select the pixels to include in the ROI. Click and drag the color bars within the histogram to select pixels. If you accessed the threshold tool from the Threshold tab, you can enable the Preview check box to see the selected pixels in the view.
- Click OK to accept the ROI. If you accessed the band threshold tool from the Threshold tab, the ROI automatically loads in the Image window. If you accessed the tool from the Toolbox, open the Data Manager and load the ROI. ENVI lists the ROI in the ROI Tool by the name of the band used to extract the ROI.
- To assign an ROI name and change the default ROI color, edit ROI Name and ROI Color values. You can also edit the Min and Max values in the table in the Threshold tab.
Convert ASCII Data to ROIs
You can create ROIs from ASCII text files or comma-separated value (CSV) files that contain data and geolocation values. An example is creating a point-based ROI from an ASCII file that contains GPS records. The ROI will contain one record consisting of all of the data points.
You can write a script to convert ASCII data to ROIs using the ASCIIToROI task.
If the data contain a combination of numeric and text values, they must be separated by commas. If the data consist entirely of numeric values, they can be separated by spaces or commas. You can add records to a new or existing ROI. ENVI will ignore any header information or column labels.
Tip: The ENVI Feature Counting Tool provides an option to export feature counts to CSV files or ASCII reports.
Follow these steps:
- From the Region of Interest Tool menu bar, select File > Import > Import from ASCII. A Select Input Coordinates File dialog appears.
- Select an ASCII text file (.txt) or CSV file (.csv) with the records you want to import and click Open. The Import from ASCII dialog appears.
The File Preview section shows the columns of data that were imported; for example:
- In the X field of Data Columns, select the column number that contains longitudes or eastings.
- In the Y field of Data Columns, select the column number that contains latitudes or northings.
Using the example above, the X field is column #3 since that column contains longitudes. The Y field is column #2 since that column contains latitudes:
- From the Geometry Type drop-down list, select the ROI geometry type to create. The choices are Polygon (default), Polyline, or Point.
- Select the Coordinate System of the imported ASCII data. See Select Coordinate Systems for further instructions. The default is Geographic Lat/Lon WGS-84.
- Click OK. The ROI geometry displays over the image that is associated with the ROI.
Convert Feature Counts to ROIs
You can create point ROIs from a saved feature count file (.efc). The ROI will have the same color as the feature counts.
You can write a script to convert feature counts to ROIs using the FeatureCountToROI task.
Follow these steps:
-
From the Toolbox, select Regions of Interest > Convert Feature Count to ROI. The Feature Count to ROI dialog appears.
-
Select an Input Feature Count File (.efc).
-
Specify an Output ROI path and filename (.xml).
-
To reuse these task settings in future ENVI sessions, save them to a file. Click the down arrow next to the OK button and select Save Parameter Values, then specify the path and filename to save to. Note that some parameter types, such as rasters, vectors, and ROIs, will not be saved with the file. To apply the saved task settings, click the down arrow  and select Restore Parameter Values, then select the file where you previously stored your settings.
-
To run the process in the background, click the down arrow next to the OK button and select Run Task in the Background. If an ENVI Server has been set up on the network, the Run Task on remote ENVI Server name is also available. The ENVI Server Job Console will show the progress of the job and will provide a link to display the result when processing is complete. See ENVI Servers for more information.
-
Click OK. ENVI adds the result to the Data Manager.
Convert GeoJSON Features to ROIs
You can convert GeoJSON features to one or more ROIs. GeoJSON is a geospatial format based on JSON code that is used for encoding geographic data structures. For more information, see the GeoJSON Format Specification. Also see the GeoJSONLint web page for example code and for tools that validate GeoJSON code.
You can write a script to convert GeoJSON features to ROIs using the GeoJSONToROI task.
Follow these steps:
- From the Region of Interest Tool menu bar, select File > Import > Import From GeoJSON. A Select Input GeoJSON File dialog appears.
- Select a .json file and click OK. The Import ROIs from GeoJSON dialog appears.
- Choose how to import the GeoJSON features into ROIs:
- If the GeoJSON file contains one feature, the "ROI to import" field lists that feature. If an existing ROI is open in ENVI, you can select Merge with active ROI name. Or, select Import as new ROI to create a new ROI from the GeoJSON feature.
- If the GeoJSON file contains multiple features, select the ROIs that you want to import. If an existing ROI is open in ENVI, you can select Merge with active ROI name. Or, select Import as new ROIs to create a new, individual ROIs from the GeoJSON features.
- Click OK.
Convert ROIs to Classification
You can convert selected ROIs into an ENVI classification image. The class colors are the same as the ROI colors.
You can also write a script to convert ROIs to a classification image using the ROIToClassification task.
-
Do one of the following:
- From the Region of Interest Tool menu bar, select Options > Create Classification Image from ROIs.
- From the Toolbox, select Regions of Interest > Convert ROIs to Classification.
The Convert ROIs to Classification dialog appears.
- Select an Input Raster and perform optional spatial and spectral subsetting.
- Select the Input ROIs.
- Specify a filename and location for the Output Raster (the classification raster).
- Enable the Preview check box to preview the settings before processing the data. The preview is calculated only on the area in the view and uses the resolution level at which you are viewing the image. To preview a different area in your image, pan and zoom to the area of interest and re-enable the Preview option. Depending on the algorithm being used by the tool, the preview result might be different from the final result of processing on the full extent, full resolution of the input image in the following scenarios: 1) If you zoomed out of the input raster in the view by 50%, or a percentage less than 50%, ENVI uses a downsampled image at the closest resolution level to calculate the preview, or 2) If the entire image is not visible in the view, ENVI uses the subset in the viewable area of the input image to calculate the preview.
- Enable the Display result check box to display the output in the view when processing is complete. Otherwise, if the check box is disabled, the result can be loaded from the Data Manager.
-
To reuse these task settings in future ENVI sessions, save them to a file. Click the down arrow next to the OK button and select Save Parameter Values, then specify the path and filename to save to. Note that some parameter types, such as rasters, vectors, and ROIs, will not be saved with the file. To apply the saved task settings, click the down arrow and select Restore Parameter Values, then select the file where you previously stored your settings.
-
To run the process in the background, click the down arrow next to the OK button and select Run Task in the Background. If an ENVI Server has been set up on the network, the Run Task on remote ENVI Server name is also available. The ENVI Server Job Console will show the progress of the job and will provide a link to display the result when processing is complete. See ENVI Servers for more information.
- Click OK.
Convert ENVI Classic ROIs to XML
ENVI Classic ROIs (.roi) have the same spatial size as their parent raster and cannot be displayed on rasters with a different resolution unless they are converted and saved to an .xml file. To convert the .roi to a georeferenced .xml, do the following:
- With a raster open and displayed, open an ENVI Classic .roi through the File menu or the Data Manager. The Choose Associated Raster of the Classic ROIs dialog appears.
- Select the raster to associate, then click OK. The ROIs open in the Layer Manager and the Image window, but the layer is not yet saved to .xml.
- In the Layer Manager, right-click the Region of Interest folder and select Save As. The Save Regions to .XML dialog appears.
- Enter a output filename, and click OK.
Convert Vectors to ROIs
To create ROIs from vectors, import a vector file, then select the vector records to convert. You can convert the records and add them to an existing ROI, or you can convert them and create a new ROI.
You can write a script to create ROIs from geometry records using the following tasks: VectorAttributeToROIs, VectorRecordsToROI, and VectorRecordsToSeparateROI.
-
Do one of the following:
- From the Region of Interest Tool menu bar, select File > Import > Import Vector.
- From the Toolbox, select Regions of Interest > Vector to ROI.
The Data Selection dialog appears.
- Select a .shp file, then click OK. The Convert Vector to ROI dialog appears.
-
Select from the following conversion parameters.
- All records to a single ROI converts the vector records to one ROI.
- Each record to a separate ROI converts each vector record to an individual ROI.
- If unique records are saved in the shapefile, select Unique records of an attribute to separate ROIs to convert vector records of an attribute type to separate layers. For example, vectors with a CLASS_ID of 0 are grouped in one ROI, vectors with a CLASS_ID of 1 are grouped in another ROI, and so forth. Select the Attribute to use from the drop-down list that appears.
- If unique attributes are saved in the shapefile, select Specific attribute query to convert vectors of the selected attribute type to a single ROI. For example, vectors with the CLASS_NAME water are converted to an ROI. Select the attribute to use from the drop-down list that appears.
- To select a subset of the vector records to output to a single ROI, select Record subset to a single ROI, then click Select Record Subset to select the records from a table as follows:
- Click to select one vector record.
- Ctrl+click to select multiple records out of sequence.
- Shift+click to select multiple records in sequence.
- Click the Select All button
 to select all vector records in the table.
- Click the Invert Selection button
 to invert the record selection (records that were selected will be deselected and records that were not selected will now be selected).
- Click OK to accept the record selections.
- The Number of Output ROIs shows how many ROIs will be output, based on your conversion choice.
- Select whether to output the ROIs to a New ROI or add them to the Active ROI.
- Enable the Display result check box to display the output in the view when processing is complete. Otherwise, if the check box is disabled, the result can be loaded from the Data Manager.
- Click OK to convert the vectors.
Report the Area of ROIs
You can view a report of the area covered by each ROI in meters, kilometers, feet, U.S. survey feet, yards, miles, nautical miles, acres, hectares, or units squared.
The pixel count relates to the resolution of the image on which the ROIs are displayed. If an ROI was defined by choosing a discrete point, that point always defines a single pixel for the ROI, regardless of the resolution of the image. So whether the image comprises 1-meter pixels or 10-meter pixels, the selected point translates to a single, 1-meter pixel. If an ROI was defined by selecting a single pixel, it is different than choosing a discrete point. In this case, the number of pixels included in the ROI is affected by the resolution of the image. If an image comprises 1-meter pixels, then an ROI defined by a single pixel translates to 10 1-meter pixels, and an image that comprises 10-meter pixels translates to 100 1-meter pixels.
- At the bottom of the ROI Tool, click the Area tab to expand it.
- Select the units to use in the report from the drop-down list.
- The ROI size is reported in the Area tab. If you are working with a very large image, the Pixel Count Refresh button is enabled. Click the button to refresh the pixel count for the ROIs.
- To save ROI Area Information to an ASCII File, click the Export Areas to ASCII button.
Save and Export ROIs
To save ROIs to the current file format:
- From the Region of Interest Tool menu bar, select File > Save.
- From the Layer Manager, right-click the Region of Interest folder or an individual ROI and select Save.
To save ROIs to XML format:
- From the Region of Interest Tool menu bar, select File > Save As. Select the ROIs to output and provide a filename, then click OK.
- From the Layer Manager, right-click the Region of Interest folder or an individual ROI and select Save As. Select the ROIs to output and provide a filename, then click OK.
To export ROIs to other formats:
- From the Region of Interest Tool menu bar, select File > Export > Export to Classic to save to a .roi file format.
- From the Region of Interest Tool menu bar, select File > Export > Export to Shapefile to save to a .shp file format.
- From the Region of Interest Tool menu bar, select File > Export > Export to CSV to save to a .csv file format.
- From the Region of Interest Tool menu bar, select File > Export > Export to GeoJSON to save to a .json file format.
Compute Statistics from ROIs
You can calculate statistics for the pixels in the ROI, including:
- Pixel count per ROI.
- Basic statistics (minimum, maximum, mean, and standard deviation) for single- or multi-band images.
- Histograms (frequency distributions) for single- or multi-band images.
For details, see Region of Interest Statistics.
Create a Buffer Zone from ROIs
You can calculate a buffer zone image from the original image. In the resulting buffer zone image, every pixel has a floating-point or integer value that is defined as the distance from that pixel to the nearest pixel of the selected ROI. Designate a maximum distance value, and the result is that any pixels with a distance larger than that value are set to the maximum distance value.
-
Do one of the following:
- From the Region of Interest Tool menu bar, select Options > Create Buffer Zone from ROIs.
- From the Toolbox, select Regions of Interest > Buffer Zone from ROIs.
The Buffer Zone from ROIs dialog appears.
-
Select an Input Raster and perform optional spatial and spectral subsetting.
- Select the Input ROIs.
- Select an option from the Output Data Type drop-down list. The choices are Integer (default) or Float.
- Optional: Specify the Maximum Distance, in pixels, for the buffer zone.
- Specify a filename and location for the Output Raster (the classification raster).
- Enable the Preview check box to preview the settings before processing the data. The preview is calculated only on the area in the view and uses the resolution level at which you are viewing the image. To preview a different area in your image, pan and zoom to the area of interest and re-enable the Preview option. Depending on the algorithm being used by the tool, the preview result might be different from the final result of processing on the full extent, full resolution of the input image in the following scenarios: 1) If you zoomed out of the input raster in the view by 50%, or a percentage less than 50%, ENVI uses a downsampled image at the closest resolution level to calculate the preview, or 2) If the entire image is not visible in the view, ENVI uses the subset in the viewable area of the input image to calculate the preview.
- Enable the Display result check box to display the output in the view when processing is complete. Otherwise, if the check box is disabled, the result can be loaded from the Data Manager.
-
To reuse these task settings in future ENVI sessions, save them to a file. Click the down arrow next to the OK button and select Save Parameter Values, then specify the path and filename to save to. Note that some parameter types, such as rasters, vectors, and ROIs, will not be saved with the file. To apply the saved task settings, click the down arrow and select Restore Parameter Values, then select the file where you previously stored your settings.
-
To run the process in the background, click the down arrow next to the OK button and select Run Task in the Background. If an ENVI Server has been set up on the network, the Run Task on remote ENVI Server name is also available. The ENVI Server Job Console will show the progress of the job and will provide a link to display the result when processing is complete. See ENVI Servers for more information.
- Click OK.
Merge ROIs
You can merge multiple ROIs into a single ROI, such as create a union or intersection.
-
Do one of the following:
- From the Region of Interest Tool menu bar, select Options > Merge (Union/Intersection) ROIs.
- From the Toolbox, select Regions of Interest > Merge (Union/Intersection) ROIs. The Data Selection dialog appears. Select the input raster and click OK.
The Merge Regions dialog appears.
- Select the ROIs to merge, or click Select All Items if you want to merge all.
- Enable the Delete Input ROIs check box to remove the individual ROI layers from the Layer Manager and Data Manager after they are merged into a single, new layer. If you leave this check box disabled, the individual ROI input layers remain open.
- Click OK. ENVI creates a new layer for the merged ROIs named Region #n. You can then load the merged ROI layer through the Data Manager.
Pixelate ROIs
To pixelate ROIs:
- From the Region of Interest Tool menu bar, select Options > Pixelate ROIs. The Choose Regions dialog appears.
- Select the ROIs to pixelate.
- Click OK.
Send ROIs to the n-D Visualizer
You can export selected ROIs to the n-D Visualizer so you can see the distribution of the points within and between the ROIs. This option is useful for checking the separability of your classes when you use ROIs as input into supervised classifications.
For good classification results using these ROIs, the groups of pixels for the different ROIs should be separate from each other and should not overlap. If the pixels overlap, edit the groups of pixels by selecting the appropriate colors from the Class menu to add pixels to an ROI or by selecting White to remove pixels from an ROI.
- From the Region of Interest Tool menu bar, select Options > Send ROIs to n-D Visualizer. The Choose ROIs dialog appears.
- Select the ROIs to load in the N-Dimensional Visualizer, then click OK. The N-Dimensional Visualizer window and the Spectral Profile appear.
See the N-Dimensional Visualizer topic for details.
Compute ROI Separability
Use the ROI Separability tool to compute the spectral separability between selected ROI pairs for a given input file. Both the Jeffries-Matusita and Transformed Divergence separability measures are reported. These values range from 0 to 2.0 and indicate how well the selected ROI pairs are statistically separate. Values greater than 1.9 indicate that the ROI pairs have good separability. For ROI pairs with lower separability values, you should attempt to improve the separability by editing the ROIs or by selecting new ROIs. For ROI pairs with very low separability values (less than 1), you might want to combine them into a single ROI.
References:
J.A. Richards, 1999, Remote Sensing Digital Image Analysis, Springer-Verlag, Berlin, p. 240.
H. Jeffreys, "An Invariant for the Prior Probability in Estimation Problems," Proc. Roy. Soc. A., Vol. 186, pp. 454-461, 1946.
-
Do one of the following:
- From the Region of Interest Tool menu bar, select Options > Compute ROI Separability.
- From the Toolbox, select Regions of Interest > ROI Separability. The Select Input File for ROI Separability dialog appears. Select the file and click OK.
The ROI Separability Calculation dialog appears.
- Select ROIs for the separability calculation.
- Click OK. The separabilities are calculated and reported in a ROI Separability Report dialog. Both the Jeffries-Matusita and Transformed Divergence values are reported for every ROI pair. The end of the report shows the ROI pair separability values listed from the least separable pair to the most separable.
- To save the report to an ASCII file, select File > Save Text to ASCII.
See Also
Region of Interest Shortcuts, Region of Interest Layers