Interactive Viewshed Analysis Tutorial
In this tutorial, you will use the interactive Viewshed Analysis tool to calculate viewshed from different observer points.
See the following sections:
Files Used in this Tutorial
Tutorial files are available from our ENVI Tutorials web page. Click the Viewshed Analysis link to download the .zip file to your machine, then unzip the files.
|
File |
Description |
|
NEONBoulderDSM.dat
|
Digital surface model (DSM) mosaic of Boulder, Colorado with 1-meter spatial resolution, acquired on 26 June 2013, saved to ENVI raster format 1
|
|
NEONBoulderDSM.hdr
|
Header file for above
|
|
NAIPBoulderAirphoto.dat
|
Aerial image mosaic of Boulder, Colorado from the National Agriculture Imagery Program (NAIP), 1-meter spatial resolution, saved to ENVI raster format 2
|
|
NAIPBoulderAirphoto.hdr
|
Header file for above
|
1 National Ecological Observatory Network. 2014. Data accessed on 24 February 2016. Available on-line at https://data.neonscience.org/home from National Ecological Observatory Network, Boulder, CO, USA.
2 Data available from the U.S. Geological Survey.
Background
Viewshed analysis is the process of identifying locations that are visible from one or more observer points (also called view sources). A gridded elevation product such as a DEM, DSM, or DTM provides the elevation values needed to determine visibility relative to the height above the terrain.
A view source can be a single observer point, multiple observer points along a path, or a multiple observer points within an area, which is shown in this tutorial.
Start the Viewshed Analysis Tool
- From the main menu, select File > Open. Navigate to the \viewshed directory where you saved the downloaded tutorial data and select the NEONBoulderDSM.dat file. Then click OK. The file opens in the view.
- From the main menu, select File > Open again. Select the NAIPBoulderAirphoto.dat file in the \viewshed directory, then click OK. The image opens in the view and overlays the DSM.
-
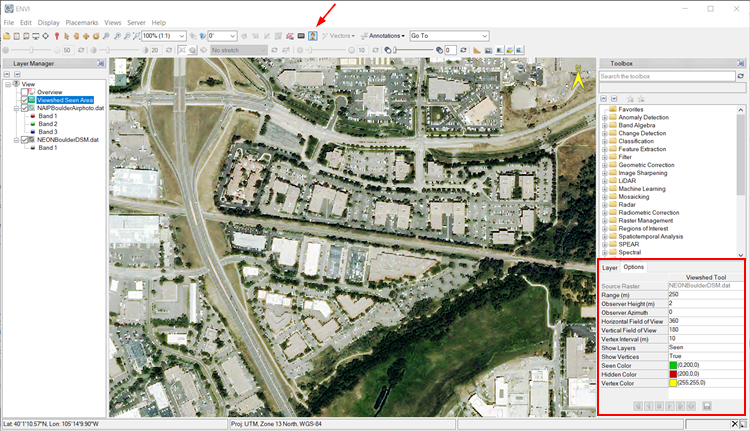
In the Toolbar, click the Viewshed Analysis button  .
.
ENVI adds a Viewshed Seen Area ROI layer to the Layer Manager. This layer will show the areas that can be seen from the observer points. The ROI layer is not attached to any rasters in the Layer Manager, which allows you to move it up and down in the layer stack and independently adjust its level of transparency.
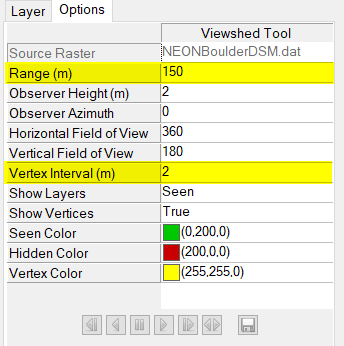
An Options tab opens in the bottom-right corner of the window. The Viewshed Tool properties in the Options tab are editable settings, including the observer point height, horizontal field of view, and vertical field of view. You can change these properties at any time during viewshed analysis.
Example 1: Examine Visibility from a Single Observer Point
One method of viewshed analysis is to use a single observer point that can can be moved around the image. You can examine what is visible from the observer point as you move it around the image. In this example, you will add an observer point, change some properties of the observer point, and move it to different locations on the image to observe how that affects the viewshed.
-
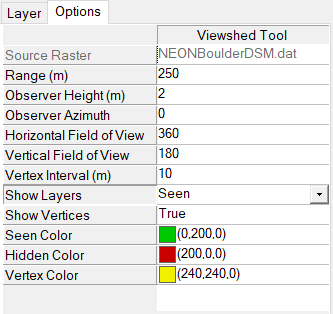
Open the images and select the Viewshed Analysis tool as described in the previous section. You will begin the exercise with the Viewshed Tool properties set to their default values:
-
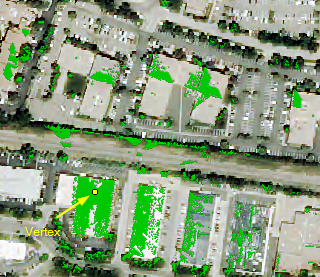
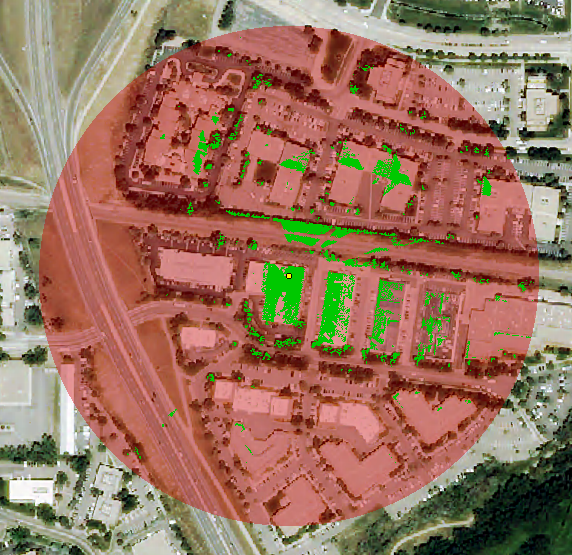
Click on a rooftop in the image. A yellow vertex is added as the observer point, and green pixels show what is visible from that point. The Vertex Color and Seen Color settings in the Viewshed Tool properties define these colors.
-
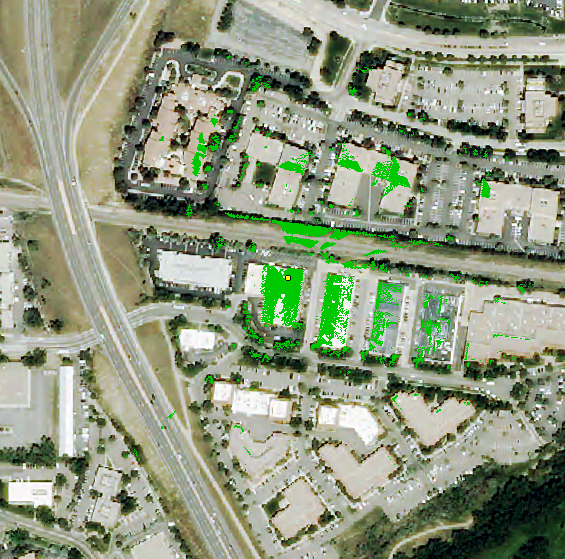
Drag the vertex to another area to move the observer point. The results show the new areas of visibility from the observer point.
Leave the observer point at the current location. In the next step, you will change some property settings, to see how they affect the viewshed results.
-
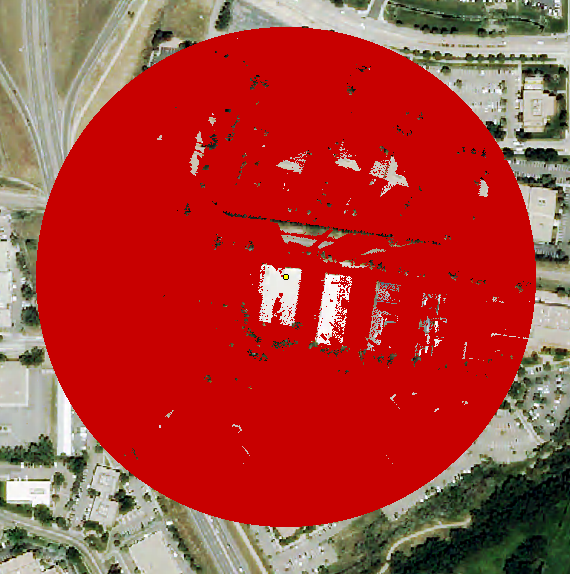
In the Viewshed Tools properties, change the Show Layers value to Hidden. The view updates to show only the areas that are hidden from the observer point. In the Layer Manager, the layer name changes from Viewshed Seen Area to Viewshed Hidden Area. With this change, pixels that are visible from the observer point will not be highlighted with a color, and pixels that are not visible from the observer point are shown in red. The display color is determined by the Hidden Color Viewshed Tool property.
-
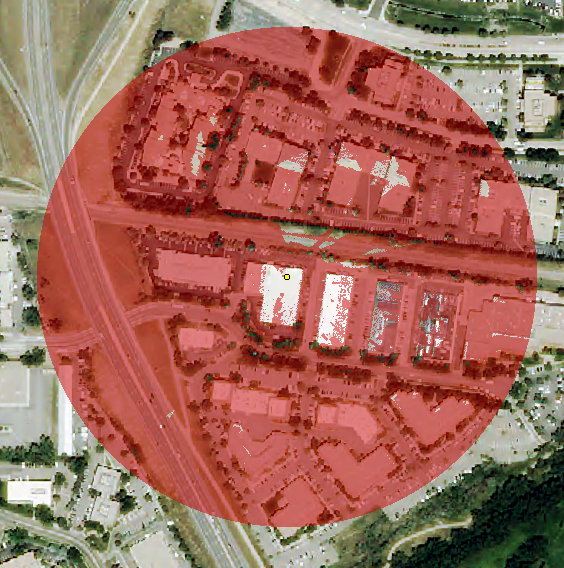
Now change the transparency of the Viewshed Hidden Area layer. First select the layer in the Layer Manager, then move the transparency slider to 50% transparency. You can see the NAIPBoulderAirphoto.dat layer through the Viewshed Hidden Area layer.
-
In the Viewshed Tool properties, change the Show Layers value to Both. The view will change show pixels that are visible from the observer point and pixels that are hidden from the observer point. An ROI layer named Viewshed Seen Area is added to the Layer Manager.
-
In the Viewshed Tool properties, change the Show Layers value to Seen. The Viewshed Hidden Area layer is removed from the Layer Manager and the Viewshed Seen Area remains. Set the Observer Azimuth value to 180 degrees, and reduce the Horizontal Field of View to 90 degrees. These settings are useful when the observer point has a fixed orientation and range of view, such as the position of a camera.
-
Click to add an observer point. The observer point is oriented 180 degrees from North, with a horizontal field of view of 90 degrees. Wherever you mark the observer point on the image, it will use these settings.
-
Now return the Observer Azimuth value to 0 degrees. This changes the horizontal orientation of the observer point (facing North), while keeping the horizontal field of view at 90 degrees. Compare the results here with what was visible in the previous step.
-
Finally, return the Horizontal Field of View to 360 degrees. Compare this to the previous two results.
-
To prepare for the next example, right-click the image and select Clear to remove the observer point and viewshed results from the view.
Example 2: Examine Visibility Along a Path
In this example, you will draw a polyline path around a building to examine the viewshed for a path around the perimeter of the building. You will step through the observer points to see the viewshed results, animate the viewshed results using the player buttons, and save the animation to an MPEG file.
-
Open the images and select the Viewshed Analysis tool as described at the beginning of this tutorial.
-
In the Viewshed Tools properties, change the following properties:
Range = 150 meters range of analysis
Vertex Interval = 2-meter spacing between vertices
Draw a Path
-
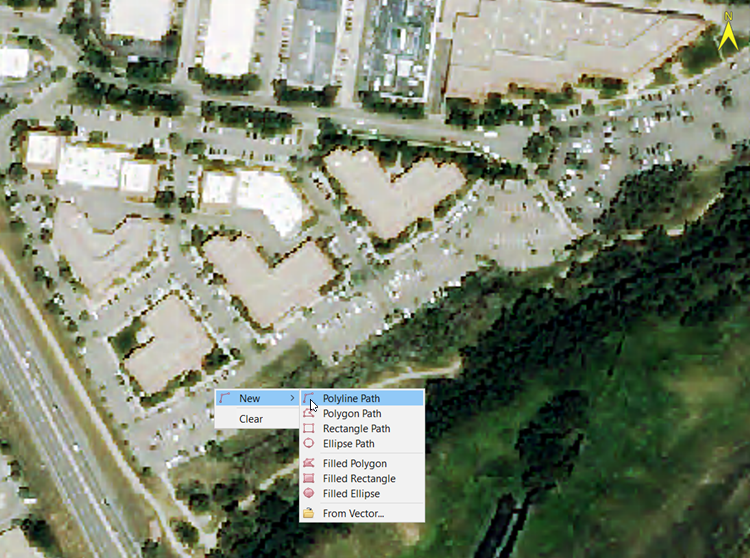
In the image, zoom in to an area with buildings, then right-click and select New > Polyline Path.
-
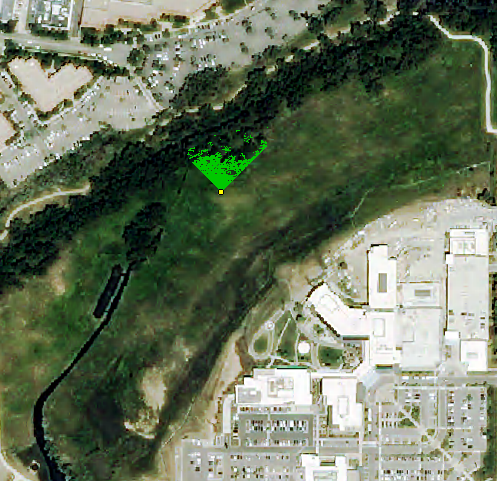
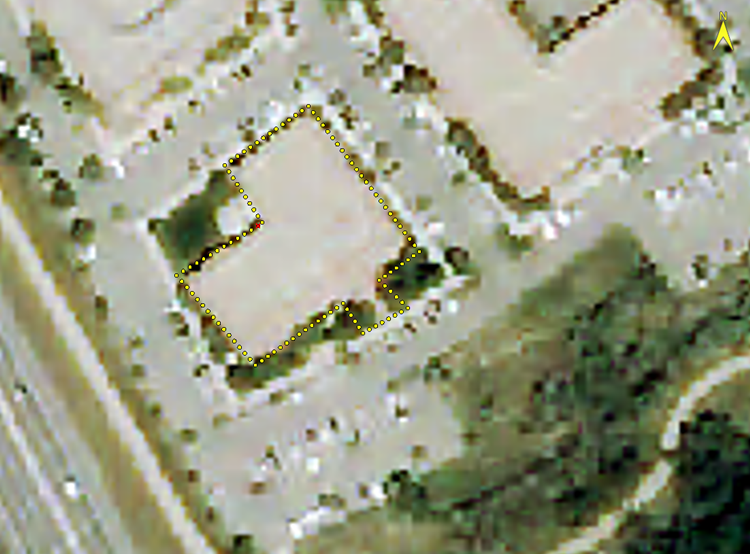
Mark a polyline around the perimiter of a building (zooming in closer, if needed). Click at intervals to go around the building to outline its shape. When you are done, double-click to set it. You should have something resembling this:
-
The yellow vertices mark all of the observer points in the path, spaced two meters apart. The red vertex marks the selected vertex, the one that will show what is visible from the selected observer point.
-
Zoom out to see more details in the view.
-
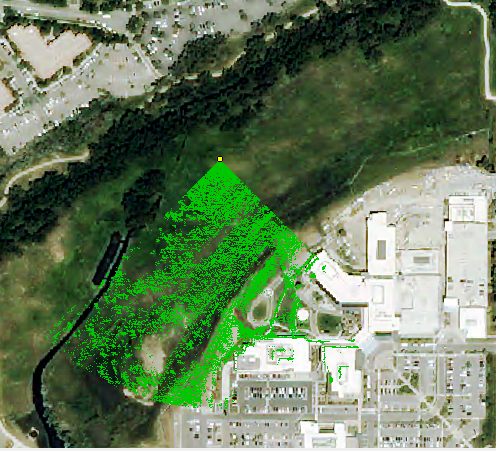
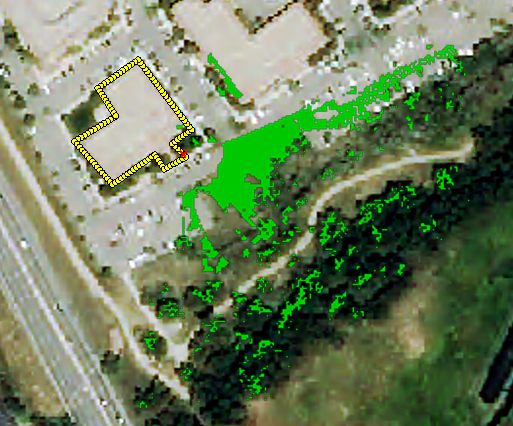
Click on a different observer point to determine what is visible from it. The areas that are visible will be highlighted in green.
-
Press the left or right Arrow key on the keyboard once. This will move you to the next observer point in the path, to show what is visible from this selected point. You can compare the image below with the image above to see how the visibility changed between the two points.
-
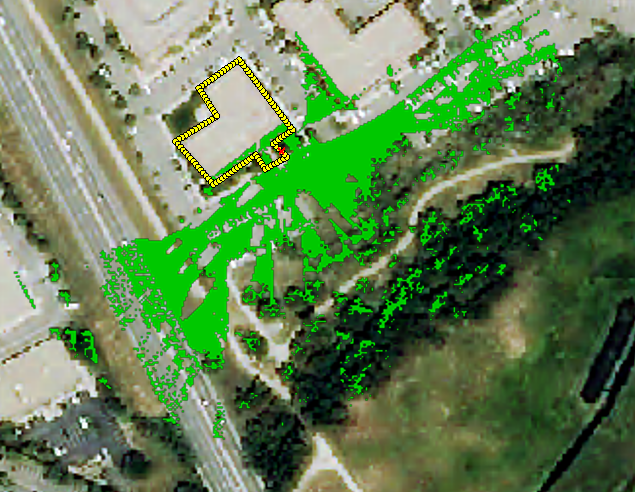
Press the left or right Arrow key again and examine how the viewshed has changed.
-
Press and hold the right Arrow key to repeatedly step through the observer points, one at a time. When you reach an area that has less visibility, stop pressing the Arrow key. Notice how a different area has lower visibility than others. Some will have almost no visibility, due to obstacles such as tree trunks, as below.
Animate the Viewshed
-
Now use animation to step through the path. Locate the player buttons at the bottom of the Options tab:
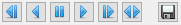
The player buttons do the following:
-
Click the Play Forwards  button to start the animation. The animation steps through the vertices to show the viewshed from each point. If you have multiple paths drawn on the image, the animation will step all the way through the first path that was drawn, then step through each successive path that was drawn, in order of creation.
-
Click the Pause button  . Animation stops.
-
Click the Play Backwards button  . The animation begins in reverse order around the path.
-
Click the Pause button . Animation stops.
-
Click the Play Back and Forth button  . The animation plays forwards to then end of the path, then reverses direction to animate backwards through the path.
-
Click the Pause button . Animation stops.
Save the Animation to an MPEG File
-
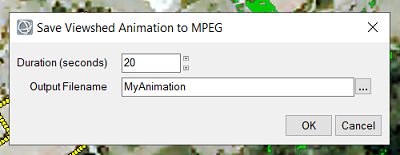
Now save the animation to an MPEG file that can be shared with others. Click the Save to MPEG File button  . The Save Viewshed Animation to MPEG dialog appears.
-
Enter the Duration, in seconds, of the animation to save in the field.
-
Enter the path and filename to save the MPEG to in the Output Filename field.
-
Click OK.
-
In the file manager on your machine, navigate to the saved MPEG file, then double-click to watch the saved animation.
-
In ENVI, right-click and select Reset to clear the image in preparation for the final example.
Example 3: Examine Visibility from an Area
In this example, you will draw filled polygons on two different rooftops to examine what is visible from both rooftops.
-
Open the images and select the Viewshed Analysis tool as described at the beginning of this tutorial.
-
In the Viewshed Tool properties, leave the properties at the settings from the previous example. If you exited ENVI after completing Example 2, you will need to reset the values as follows:
Range = 150 meters
Vertex Interval = 2 meters
Draw Filled Polygon Areas
-
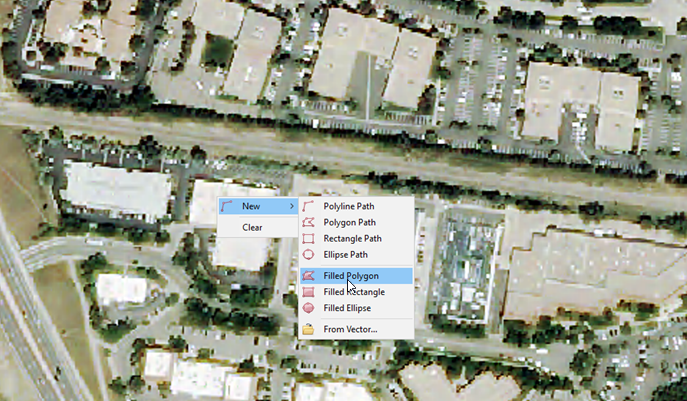
In the image, zoom in to an area of buildings, then right-click and select New > Filled Polygon.
-
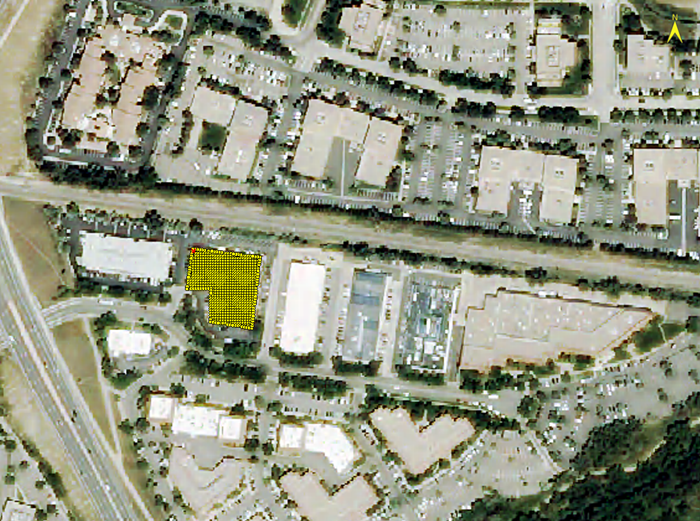
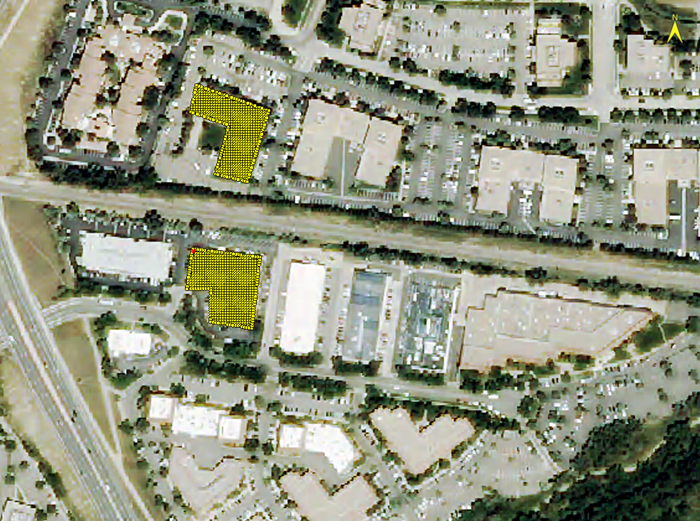
Click to mark the shape of a rooftop, then right-click and select Complete and Accept Polygon.The rooftop is marked with yellow vertices at two-meter intervals.
-
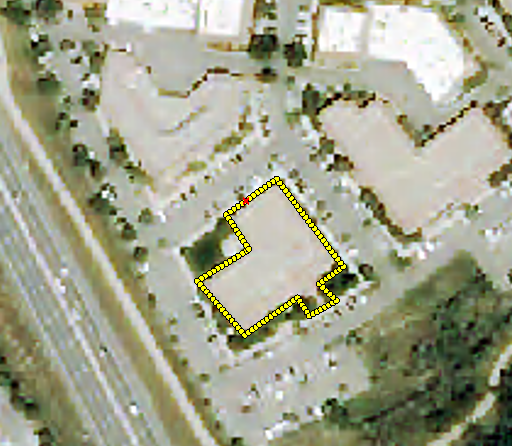
Now you will add a second filled polygon. Right-click and select Add > Filled Polygon, then repeat the steps to draw a filled polygon on a rooftop directly across from the first polygon you drew . You should have two filled polygon areas resembling this:
Animate the Viewshed
-
Use animation to step through the two areas. Locate the player buttons at the bottom of the Options tab:
-
Click the Play Forwards button to start the animation. The animation steps through the vertices in the area to show the viewshed from each point. It will step through the first polygon you created, then automatically step through the second one you created. image.
-
Click the Pause button . Animation stops.
-
Click the Play Backwards button to play the animation in reverse order.
-
Click the Pause button . Animation stops.
-
Click the Play Back and Forth button to play the animation forwards, then when it reaches the last of all of the observer points, play the animation in reverse order.
-
Click the Pause button . Animation stops.
-
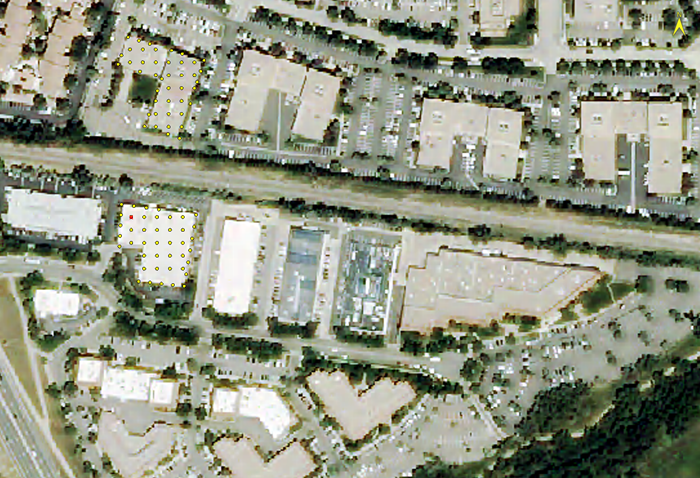
Change the Vertex Interval value in the Viewshed Tool properties to 10 meters. You will see that the spacing between the vertices on the rooftops increases.
-
Click the Play Forwards button to start the animation again. With the vertices spaced farther apart, the animation cycles through all observer points faster.
-
Click the Pause button . Animation stops.
Next, you will create a layer of the full viewshed results, and create a heatmap that shows what was most visible from the two polygon areas to what was least visible.
Create Full Viewshed Results and Heatmap
-
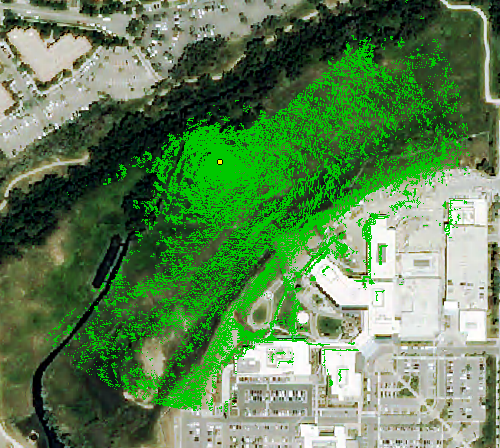
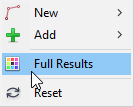
Right-click on the view and select Full Results. ENVI generates the results of the viewshed from all observer points in both polygons.
-
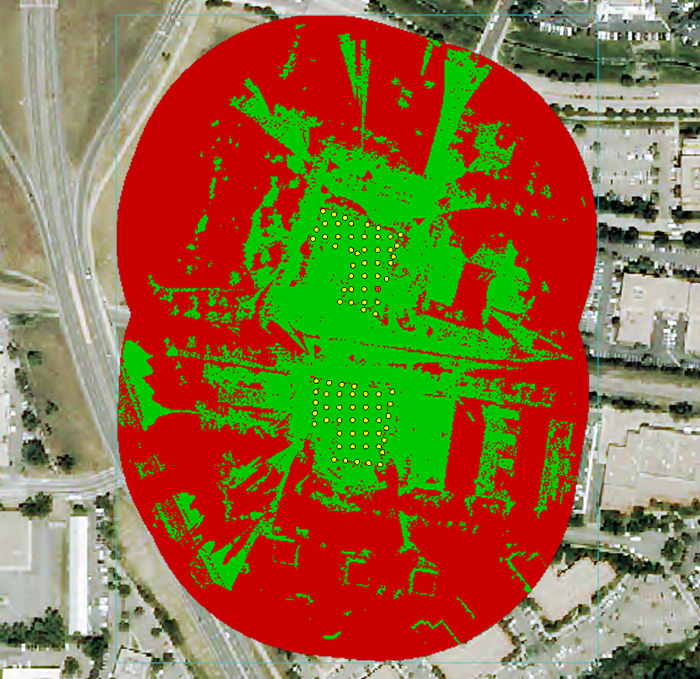
The Full Seen/Hidden Map layer overlays the image layer. It includes classes for Seen (green) and Hidden (red), which are enabled. Green pixels indicate that at least one of the observer points was able to see them, while red pixels indicate that no observer points were able to see them.
-
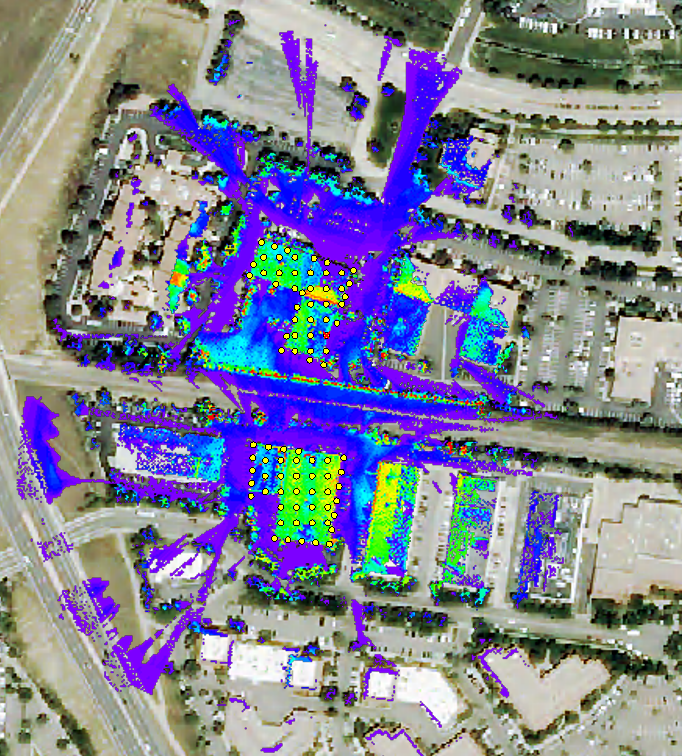
In the Layer Manager, disable the check box for the Full Seen/Hidden Map layer to view the Seen Heatmap. The heatmap layer was generated with the Full Results option.
-
In the heatmap, pixels in warm to hot colors were seen by the most observer points, and pixels in cool to cold colors were seen by the least observer points. Red is the warmest color, and purple is the coldest color.
Save Full Results and Heatmap to Files
Save the results of the Full Seen/Hidden Map and Seen Heatmap output to files
-
Right-click in the view and select Save > "Full Seen/Hidden Map" to File.
-
In the dialog that displays, enter the path and filename, then click Save. In the Layer Manager, the name you save the file to will replace Full Seen/Hidden Map in the Layer Manager.
-
Right-click in the view and select Save > "Seen Heatmap" to File.
-
Enter the path and filename, then click Save. In the Layer Manager, the name you save the file to will replace Seen Heatmap in the Layer Manager.
-
When you are finished, exit ENVI.