Before processing the data, it is recommended that you generate a density map to check the point density of the LiDAR raw data. The more points per square meter, the more accurately ENVI LiDAR can identify features for extraction and avoid false readings. ENVI LiDAR is able to process buildings and trees when the density is as low as 1 to 2 points per square meter; however, those results will likely contain many false readings. To achieve better results for building and tree extraction, use data with a minimum density of 5 to 6 points per square meter.
To generate a density map:
- Select Process > Generate Density Map from the menu bar. The Select Format dialog appears.
-
Select an output Format from the drop-down list, then click OK. The Show Density Map dialog appears.
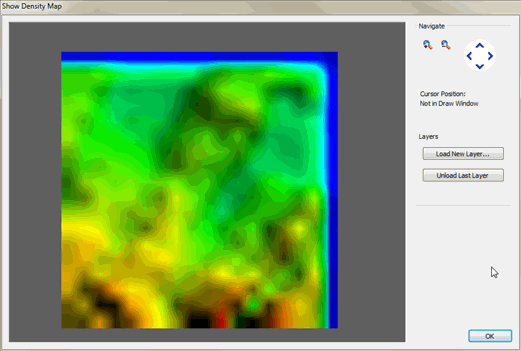
The density map shows higher and lower density by variation in color. The coordinates and density of the Cursor Position display in the Navigate area of the dialog, and the information updates as you move the cursor over the density map.
Navigate the map using the zoom in/out and pan buttons. If you have an existing vector file that might help with orientation, you can open and display it as a layer on top of the elevation map. Click Load New Layer to load the vector file. Only one file can be shown at a time; to remove the previously-loaded layer, click Unload Last Layer.
- When finished, click OK. ENVI LiDAR saves the density map in the \Products directory as TilesDensity.fmt where .fmt is the extension for the selected format. It also saves a TilesDensity.csv file in the same directory.
You can open the .csv file in a spreadsheet application. The first column lists densities in increments of 0.2 points per square meter. The second column shows the number of blocks with that density.