RX Anomaly Detection
RX Anomaly Detection uses the Reed-Xiaoli Detector (RXD) algorithm to detect the spectral or color differences between a region to be tested and its neighboring pixels or the entire dataset.
You can also write a script to perform RX anomaly detection using the RXAnomalyDetection task.
See the following sections:
Background
The Reed-Xiaoli Detector (RXD) algorithm extracts targets that are spectrally distinct from the image background. For RXD to be effective, the anomalous targets must be sufficiently small, relative to the background. Results from RXD analysis are unambiguous and have proven very effective in detecting subtle spectral features. ENVI implements the standard RXD algorithm:
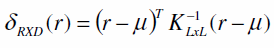
Where r is the sample vector, m is the sample mean, and KLxL is the sample covariance matrix.
RXD works with multispectral and hyperspectral images. Bad pixels or lines appear as anomalous, but they do not affect the detection of other, valid anomalies. As with any spectral algorithm, exclusion of bad bands increases the accuracy of results. Currently, this algorithm does not differentiate detected anomalies from one another.
Run the RX Anomaly Detection Tool
- From the Toolbox, select Anomaly Detection > RX Anomaly Detection. The RX Anomaly Detection dialog appears.
- Select a multi-band file for the Input Raster. Perform optional spatial and spectral subsetting and/or masking, and click OK.
- Select an algorithm from the Anomaly Detection Method drop-down list. The choices are:
- RXD: Standard RXD algorithm
- UTD: Uniform Target Detector, in which the anomaly is defined using (1 - μ) as the matched signature, rather than (r - μ). UTD and RXD work exactly the same, but instead of using a sample vector from the data (as with RXD), UTD uses the unit vector. UTD extracts background signatures as anomalies and provides a good estimate of the image background.
- RXD-UTD: A hybrid of the RXD and UTD methods, in which (r - 1) is used as the matched signature. This is a variant of the UTD approach. Subtracting UTD from RXD suppresses the background and enhances the anomalies of interest. The best condition to use RXD-UTD is when the anomalies have an energy level that is comparable to, or less than, that of the background. In this case, using UTD by itself does not detect the anomalies, but using RXD-UTD enhances them.
- From the Mean Calculation Method drop-down list, select how the mean spectrum will be determined. The choices are:
- Global: The mean spectrum will be derived from the full dataset
- Local: The mean spectrum will be derived from a localized kernel around the pixel
- In the Kernel Size field, enter the kernel size (in pixels) around a given pixel that will be used to create a mean spectrum. Use an odd number. The minimum value is 3, and the maximum value is (number of columns - 1) less than (number of rows - 1). The default value is 9.
- Choose the Yes option for Suppress Vegetation if you want to suppress the vegetation signal in the image. See Vegetation Suppression for details. The default option is No.
- Enter a filename and location for the Output Raster.
- Enable the Preview check box to preview the settings before processing the data. The preview is calculated only on the area in the view and uses the resolution level at which you are viewing the image. To preview a different area in your image, pan and zoom to the area of interest and re-enable the Preview option. Depending on the algorithm being used by the tool, the preview result might be different from the final result of processing on the full extent, full resolution of the input image in the following scenarios: 1) If you zoomed out of the input raster in the view by 50%, or a percentage less than 50%, ENVI uses a downsampled image at the closest resolution level to calculate the preview, or 2) If the entire image is not visible in the view, ENVI uses the subset in the viewable area of the input image to calculate the preview.
- Enable the Display result check box to display the output in the view when processing is complete. Otherwise, if the check box is disabled, the result can be loaded from the Data Manager.
-
To reuse these task settings in future ENVI sessions, save them to a file. Click the down arrow next to the OK button and select Save Parameter Values, then specify the path and filename to save to. Note that some parameter types, such as rasters, vectors, and ROIs, will not be saved with the file. To apply the saved task settings, click the down arrow  and select Restore Parameter Values, then select the file where you previously stored your settings.
-
To run the process in the background, click the down arrow next to the OK button and select Run Task in the Background. If an ENVI Server has been set up on the network, the Run Task on remote ENVI Server name is also available. The ENVI Server Job Console will show the progress of the job and will provide a link to display the result when processing is complete. See ENVI Servers for more information.
- Click OK.
Bright pixels in the output image represent targets that are spectrally distinct from the image background.
References:
Chang, C.-I., and S.-S. Chiang. "Anomaly Detection and Classification for Hyperspectral Imagery." IEEE Transactions on Geoscience and Remote Sensing 40, No. 6 (2002): 1314-1325.
Reed I., and X. Yu, "Adaptive Multiple-Band CFAR Detection of an Optical Pattern with Unknown Spectral Distribution." IEEE Transactions on Acoustics, Speech and Signal Processing 38 (1990): 1760-1770.
See Also
Anomaly Detection Workflow