This tutorial shows how to construct a time series from eight Landsat images of Las Vegas, Nevada, each May from 1985 to 2020. You will learn how to use the Series Manager to animate the time series and to export the animation to video. The tutorial also includes code examples that show how to perform these tasks in batch mode using the ENVI application programming interface (API).
See the following sections:
Also see the Sentinel-2 Time Series Analysis Tutorial.
Files Used in this Tutorial
Tutorial files are available from our ENVI Tutorials web page. Click the Landsat Case Study link to download the .zip file to your machine, then unzip the files.
The files contain Landsat Collection 1 Analysis Ready Data (ARD); specifically, Surface Reflectance images at 30-meter resolution.
|
Filename |
Sensor |
Acquisition Date
|
Source ID |
|
LasVegasMay1985.dat
|
TM 5 |
1985-05-18 |
LT05_CU_005011_19850518_20190604_C01_V01
|
|
LasVegasMay1990.dat
|
TM 5 |
1990-05-16 |
LT05_CU_005011_19900516_20190530_C01_V01
|
|
LasVegasMay1995.dat
|
TM 5 |
1995-05-14 |
LT05_CU_005011_19950514_20190125_C01_V01
|
|
LasVegasMay2000.dat
|
TM 5 |
2000-05-27 |
LT05_CU_005011_20000527_20190116_C01_V01
|
|
LasVegasMay2005.dat
|
TM 5 |
2005-05-25 |
LT05_CU_005011_20050525_20190108_C01_V01
|
|
LasVegasMay2010.dat
|
TM 5 |
2010-05-07 |
LT05_CU_005011_20100507_20190211_C01_V01
|
|
LasVegasMay2015.dat
|
8 |
2015-05-05 |
LC08_CU_005011_20150505_20190502_C01_V01
|
|
LasVegasMay2020.dat
|
8 |
2020-05-18 |
LC08_CU_005011_20200518_20210407_C01_V01
|
The source files were downloaded from the U.S. Geological Survey (USGS) EarthExplorer web site. They were originally in an Albers Equal-Area WGS-84 projection. They were pre-processed as follows:
- Reprojected to a UTM Zone 11N WGS-84 coordinate system
- Regridded to a common spatial grid. This ensures that the same pixel across multiple images references the same geographic location over time. Regridding images to a common spatial grid is highly recommended if you will be doing a time-series analysis. The common grid used in this tutorial has the following parameters:
- Upper-left corner: 36.34°N, 115.39°W
- Upper-right corner: 36.34°N, 114.88°W
- Lower-left corner: 35.91°N, 115.39°W
- Lower-right corner: 35.91°N, 114.88°W
- Pixel size: 30 meters
- Coordinate system: UTM Zone 11N WGS-84
An IDL program was written to perform these steps in batch mode. A copy of this program is included with the tutorial data (PreprocessLandsatSeries.pro).
The OSAVI directory contains a set of Optimized Soil Adjusted Vegetation Index (OSAVI) images for each Landsat image. These have the same spatial extent and acquisition times as the Landsat images.
Case Study: Las Vegas Growth
Las Vegas is one of the fastest growing metropolitan areas in the United States. According to the U.S. Census Bureau, the population of the Las Vegas-Henderson-Paradise, NV Metropolitan Statistical Area (MSA) in 1970 was 273,288 people. The population in 2019 was over 2.2 million people.
Remote sensing imagery can be used to monitor the expansion of urban areas over time. High spatial resolution images are preferred for studying different features within an urban area. Of particular interest is the increase in impervious surfaces over time (roads, buildings, parking lots, etc.) High-resolution imagery for an entire metropolitan area may be difficult to obtain and can consume a lot of disk space. Lower-resolution imagery such as the Landsat legacy products are freely available from the USGS and are often suitable for studying urban sprawl over a large spatial extent.
The following change detection image shows the difference in man-made features from 1985 to 2020. Normalized Difference Built-Up Index images were created from a 1985 Landsat TM image and a 2020 Landsat 8 image. This two-Color MultiView (2CMV) image, which shows built-up features (in red) added since 1985.
Change detection can only provide a "before and after" scenario; a time-series analysis provides an opportunity to study patterns and key changes in urban growth over time. For this tutorial, you will evaluate Landsat images every five years over a 35-year period.
Build a Time Series
In these steps you will build a raster series, which is a collection of images (rasters) used for spatiotemporal analysis. These steps create a series file, which is a metadata file with a .series file extension. The series file does not contain any imagery; it only references the file locations of the source rasters.
If the ENVI header files associated with the source rasters contain an acquisition time metadata field, you have the option to order the series by time.
- Start ENVI.
- From the menu bar, select File > Preferences.
- Click the Data Manager item on the left side of the Preferences dialog.
- Click in the white space next to Auto Display Method for Multispectral Files, and select CIR from the drop-down list that appears. This will display all rasters within the series in a color-infrared band combination.
- Click OK in the Preferences dialog.
- From the menu bar, select File > New > Build Raster Series. The Build Raster Series dialog appears.
- Click the Add Raster button, then select Add Filename.
- Go to the directory where you saved the tutorial data files.
- Use the Ctrl or Shift key on your keyboard to select the files LasVegasMay1985.dat through LasVegasMay2020.dat (8 files total). Click Open. The fiilenames appear in the file selection dialog.
- Enable the Order By Time option. This will order the rasters by the time listed in the acquisition time metadata field of each ENVI header file.
- Click the Browse button next to the Output Filename field, and go to the same directory where you saved the tutorial data files.
- Name the series file LasVegas. Click the Open button in the Select Output Filename dialog. ENVI automatically appends a .series extension to the filename.
- Enable the Display result option.
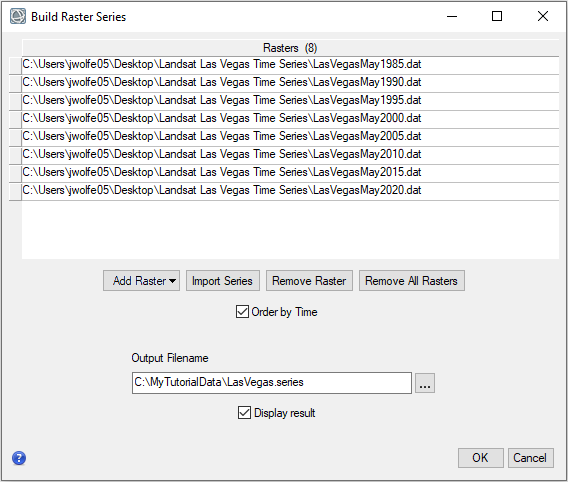
- Click OK when you are finished.
View a Time Series
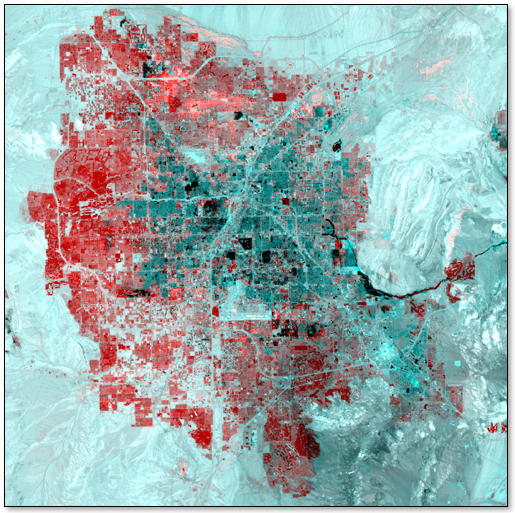
Once ENVI creates the time series, the Series Manager appears in the display. Since the series is ordered by time, the image with the earliest time is displayed first. Since the images are displayed in a CIR band combination, vegetation appears bright red.
The different components of the Series Manager are described as follows:
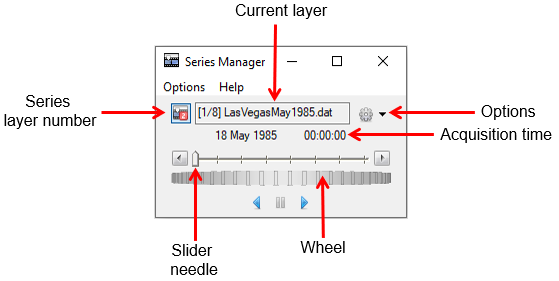
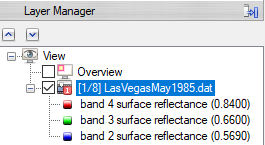
Each series is a unique layer in ENVI; it appears in the Layer Manager and is represented by a numbered icon here and in the Series Manager:
Any display operations such as zooming, rotating, or changing the stretch will apply to the entire series, not any specific image within the series. As you scroll through the time series using the navigation tools, the current layer name updates accordingly.
Follow these steps to proceed through the time series:
- Right-click on the series layer in the Layer Manager and select Zoom to Layer Extent.
- From the Stretch drop-down menu in the main toolbar, select Linear 1%.
- Click the Forward
 button or click and drag the wheel to step through the series one frame at a time. The associated image is displayed at each frame.
- Click and drag the slider needle to move to another point in the series, without updating each image. This allows for a quick selection of a particular frame since you can see the dates or band names in the series. The associated image will load once you release the mouse button.
- Click the Play forward
 button to animate the series. While the series is animating, choose a delay time in seconds (between frames) using the drop-down list next to the play button.
- When the series displays LasVegasMay2020.dat, click Pause
 to stop the animation.
- Click the Options drop-down button
 in the Series Manager, and select Load Current Raster. ENVI opens the associated image (LasVegasMay2020.dat) as a separate layer in the Layer Manager and Data Manager so that you can work with the image apart from the time series:
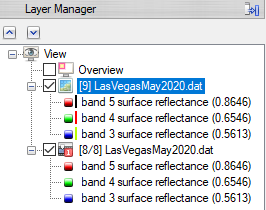
Loading a currently displayed raster allows you to further explore an image of interest and to use any of ENVI's processing tools with the image, without affecting the series.
- Right-click on the LasVegasMay2020.dat layer in the Layer Manager and select Remove.
Tip: If all of the rasters in a series have the same band names and number of bands, plus the same spatial grid, then you can create a time series plot. You can do this by clicking the Options drop-down button and selecting Series Profile. Although the rasters in this Landsat series are gridded to the same spatial reference, the bands are different between Landsat 5 TM and Landsat 8. So the Series Profile option is not available for use. See the Series Profile help topic for more information.
Multiple Layers
In these steps, you will view another series of Las Vegas images from 1985 to 2020 and link this series with the one you just viewed. These images represent an Optimized Soil Adjusted Vegetation Index (OSAVI) and were created using the ENVI Spectral Index tool. OSAVI is especially sensitive to vegetation cover greater than 50% and is best suited for areas with relatively sparse vegetation, where the soil is visible through the canopy.
- From the menu bar, select Views > Two Vertical Views.
- Click inside of the second view to select it. A cyan-colored border surrounds the empty view.
- From the menu bar, select File > Open.
- Navigate to the directory where you saved the OSAVI files (from the OSAVI tutorial directory).
- Select the file OSAVI.series, and click Open.
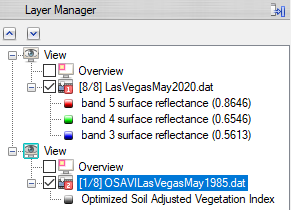
The OSAVI series displays in the second view, and the Series Manager updates to show the OSAVI series. The Layer Manager lists each series in a separate View layer:
- Right-click on both series layer names in the Layer Manager and select Zoom to Layer Extent.
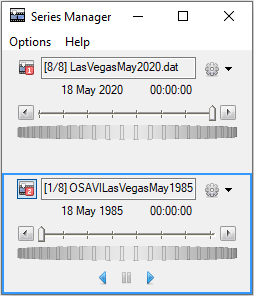
- From the Options menu of the Series Manager, select Show All Sliders. A new panel appears that allows you to navigate through the two series, independent of each other. The following shows an example:
A more common scenario is to link the two series by time. You will do this next.
- Click the bottom Options drop-down button in the Series Manager (i.e., the one for the OSAVI series layer). Select Link To > [#/#] LasVegas<date>.dat (where # is the current frame number). This creates a temporal link between the two series. The display should look like this:
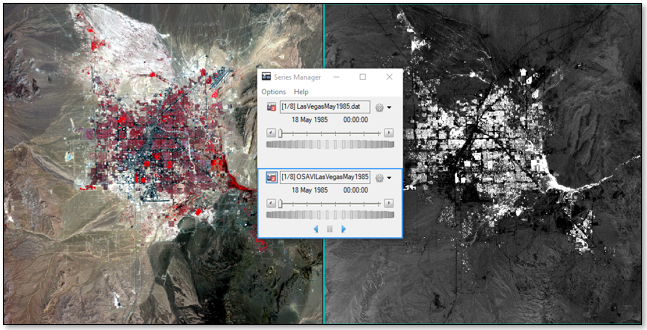
- Use the navigation tools in the Series Manager to step through the time series. Since the images are linked by time, the Landsat image and its corresponding OSAVI image for the same date are displayed simultaneously.
- When you are finished examining the two series, right click on the View layer that contains the OSAVI series in the Layer Manager and select Remove View. Only the original Landsat series is displayed.
Annotate the Series
If the ENVI header files of each image in the series contain an acquisition time field, you can annotate the time series with the date and time of each frame.
- Right-click on the series layer in the Layer Manager and select Zoom to Layer Extent.
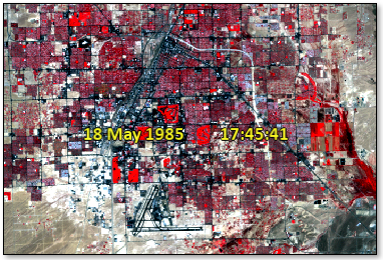
- Click the Options drop-down in the Series Manager, and select Annotate > Date and Time. The date and time are added to the display; for example:
- Click the annotation to select it. In the lower-right corner of the ENVI application, a property sheet appears for the selected annotation item:
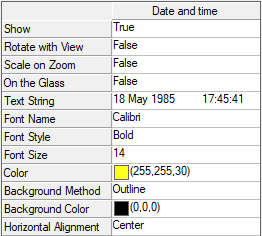
- Click the Font Size field and change the size to 24.
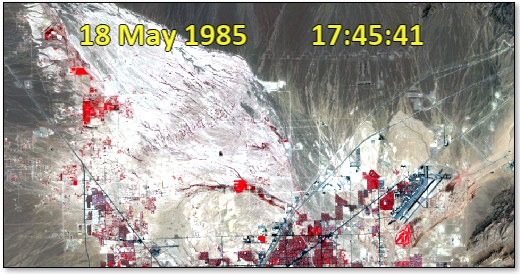
- Click and drag the selected annotation item to the top of the image; for example:
- Use the navigation tools in the Series Manager to step through the series. The date/time annotation updates with each frame.
- Optional step: Right-click on the Series Metadata layer in the Layer Manager and select Save As. Enter an output fiilename and directory for the annotation file (.anz).
Create a Video File
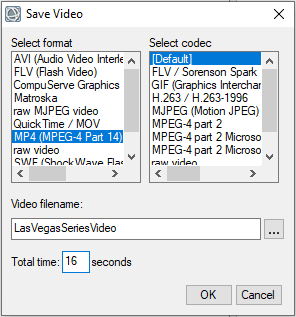
- Click the Options drop-down button in the Series Manager, and select Save Video Animation. The Save Video dialog appears.
- Click the Advanced button.
- In the Select format list, choose MP4 (MPEG-4 Part 14).
- In the Select codec list, choose [Default].
- Click the Browse button next to Video filename, and navigate to a directory where you want to save the video file.
- Enter an output filename of LasVegasSeriesVideo. Click Save.
- There are 8 frames in this series; 2 seconds is a reasonable time to view each frame. In the Save Video dialog, enter a Total time of 16 seconds.
- Click OK. ENVI steps through each frame in the series and creates the video file.
If the saved video file does not play for any reason, try selecting a different format (for example, AVI).
- To learn more about working with series files and animating through image bands, click Help in the Series Manager menu bar and select Series/Animation Help.
- When you are finished, exit ENVI.