Thematic Change Tool
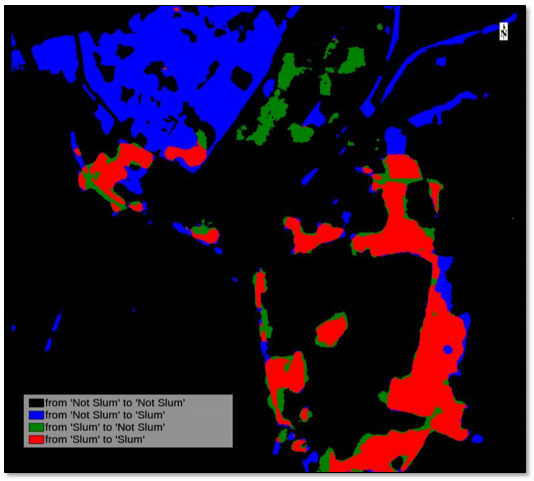
The Thematic Change tool takes two classification images of the same geographic area taken at different times and identifies differences between them. The resulting classification image shows class transitions, for example, from class 1 to class 2. Thematic change detection can be used to analyze land use, land cover change, deforestation, urbanization, agricultural expansion, water variability, and more.
This tool provides a quicker and simpler way to perform thematic change detection, compared to the Thematic Change Workflow.
You can write a script to perform thematic change using the ThematicChange task.
Follow these steps:
- From the ENVI Toolbox, select Change Detection > Thematic Change. The Thematic Change dialog appears.
- In the Input Raster 1 field, select a classification image that represents the earliest date for change detection.
- In the Input Raster 2 field, select a classification image that represents the last date for change detection. If both images do not have the same dimensions or pixel sizes, then Input Raster 2 will be regridded to match Input Raster 1.
- The Only Include Areas That Have Changed option is enabled by default. If the two input classification images have the same number of classes that use the same class name, ENVI groups those classes into a class named no change if there was no difference detected during processing. If you set this option to No, the output will be a new classification image that includes all class transition information.
- Select an Output Raster filename and location.
- Enable the Preview check box to preview the settings before processing the data. The preview is calculated only on the area in the view and uses the resolution level at which you are viewing the image. To preview a different area in your image, pan and zoom to the area of interest and re-enable the Preview option. Depending on the algorithm being used by the tool, the preview result might be different from the final result of processing on the full extent, full resolution of the input image in the following scenarios: 1) If you zoomed out of the input raster in the view by 50%, or a percentage less than 50%, ENVI uses a downsampled image at the closest resolution level to calculate the preview, or 2) If the entire image is not visible in the view, ENVI uses the subset in the viewable area of the input image to calculate the preview.
- Enable the Display result check box to display the output in the view when processing is complete. Otherwise, if the check box is disabled, the result can be loaded from the Data Manager.
-
To reuse these task settings in future ENVI sessions, save them to a file. Click the down arrow next to the OK button  , select Save Parameter Values, then specify the path and filename to save to. Note that some parameter types, such as rasters, vectors, and ROIs, will not be saved with the file. To apply the saved task settings, click the down arrow and select Restore Parameter Values, then select the file where you previously saved your settings.
-
You can run the process in the background on your computer or in the background on an ENVI Server (if available). Click the down arrow next to the OK button and select one of the following:
- Run Task in the Background: Runs the process on your computer. This method does not use an ENVI Server. The job progress will show in the ENVI Job Console's Background Jobs tab.
- Run Task on envi_server_name. Runs the process on the selected ENVI Server. The job progress will show in the ENVI Job Console's envi_server_name tab.
See ENVI Job Console for details on monitoring ENVI Server jobs and viewing results. See ENVI Servers for details on configuring and using an ENVI Server.
-
To see an ENVI Modeler version of this tool that shows how it is constructed from individual tasks, click Open in Modeler.
- Click OK.