Tutorial: Interactive Viewshed Analysis Tutorial
The Viewshed Tool helps you analyze areas (targets) that are visible from an observer point. You can also perform a reverse viewshed to identify areas from which the observer point is visible.
An observer point can be an individual point that you can move around the image or multiple observer points that can be created as paths or areas. The results of the viewshed or reverse viewshed can be animated, and you can save the animation a video to share with others.
Ideally, a viewshed or reverse viewshed will show unobstructed views between observer points and targets in any direction; however, the results can be affected by the following factors:
- Observer height
- Target height
- Topography
- Distance
- Obstructions
The Viewshed Tool uses property settings for height and distance and gridded elevation data such as a DEM, DSM, or DTM is used to compute the line of sight between observer points and targets in the landscape.
The Izraelevitz (2003) algorithm is used for ENVI's viewshed analysis, which is an extension to the original Xdraw algorithm developed by Franklin et al. (1994). The Izraelevitz algorithm performs well in densely sampled terrain elevation models, and it is significantly faster than a radial interpolation method. The Izraelevitz algorithm does not compute a true line-of-sight function but rather an approximation.
Reference: Izraelevitz, D. "A Fast Algorithm for Approximate Viewshed Computation." Photogrammetric Engineering & Remote Sensing 69, No. 7 (2003): 767-774.
See the following sections for details:
You can also write a script to perform viewshed analysis using the RasterViewshed task. The task provides results of viewshed analysis but is not interactive.
Viewshed Tool
-
From the main menu, select File > Open and select a DEM, DSM, or DTM file. If you select a multi-band file, select the band to use. See The Data Selection dialog for details.
You can optionally open a raster at the same time to use with the gridded elevation layer in the view. This can be useful when selecting observation points.
-
In the ENVI Toolbar, click the Viewshed Tool button  . The Viewshed Tool dialog appears and the Viewshed check box is enabled, which means a Viewshed ROI layer will be added to the Layer Manager. The Viewshed layer will show the areas that are visible from the observer points; it is not attached to any rasters in the Layer Manager, which allows you to move it up and down in the layer stack and independently adjust its level of transparency.
You can also toggle to the Viewshed Tool Mode to Reverse Viewshed (Targets). ENVI adds the Reverse Viewshed layer which will show the areas from which the observer points can be seen.
-
Next, add observer points on the image in the following ways:
- Add a single observer point that can be moved around the image.
- Add one or more individual points observer points to different areas of the image.
- Add one or more fixed paths that contain multiple observer points along the path.
- Add one or more fixed areas that contain multiple observer points within the area.
- Import vectors from an associated file to use as paths and areas.
Add an Observer Point
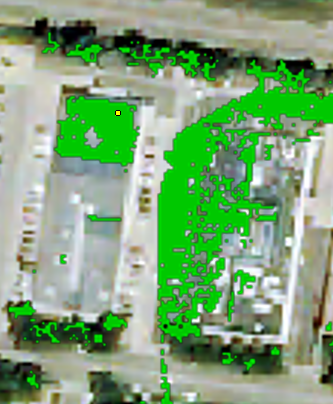
- Click in the image to add a yellow-colored observer point. The view updates to show targets that are visible from the observer point in green.
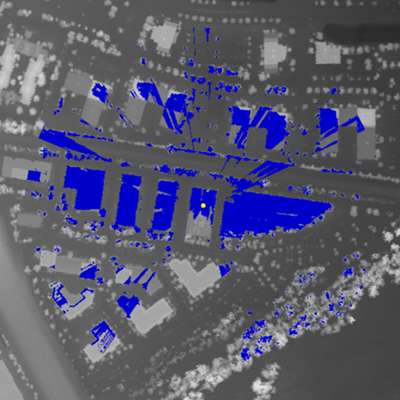
- To do a reverse viewshed and identify areas that can see the observer point, select the Reverse Viewshed (Targets) option in the Viewshed Tool dialog. Areas from which the observer point can be seen are shown in blue. Switching to Reverse Viewshed mode takes several seconds to display the result.
- You can move the location of the observer point by clicking on a new location or by dragging the point to a new location. The viewshed or reverse viewshed results refresh as the observer point position changes.
- To remove the observer point, right-click it and select Clear.
The images below show examples of a viewshed (green) and a reverse viewshed (blue) using the same observer point. You can use either mode for individual points, paths, and areas.
Add Individual Observer Points
You can add one or more individual fixed observer points to locations in the view.
- Right-click on the view and select New > Individual Points. Or, in the Viewshed Tool, click the Define drop-down list and select New > Individual points. The cursor turns into a + symbol.
- Click on areas in the view to add each point.
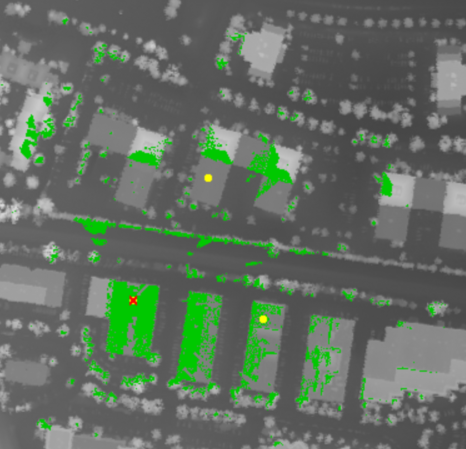
- When you are finished adding points, right-click and select Accept Points. ENVI highlights the first point you added in red and green pixels show the targets that are visible from the selected observer point.
- To move between observer points and see what is visible from each, use the Left and Right arrow keys on the keyboard or click on each point.
- To remove the points, right-click and select Reset.
Add a Path or Area of Observer Points
A path contains multiple vertices, where each vertex is an observer point. You can create paths with a polyline, polygon, rectangle, or ellipse. An area is a polygon filled with multiple vertices, where each vertex is an observer point. You can create areas with filled polygon, rectangle, or ellipse shapes.
The vertices in a path or area are spaced at a pre-set interval; the default setting is 1 vertex every 10 meters. To change the interval, enter a new value in the Vertex Interval (m) field in the Viewshed Tool dialog.
You can draw one or more paths/areas on the image, and you can use a combination of them in your analysis.
- Right-click in the view and select New > type. Or, in the Viewshed Tool dialog, click the drop-down arrow
 next to Define and select New > type.
- Click at intervals to draw the line or shape. If you are drawing a polygon shape, you can also use the Magic Wand tool to draw it. Do Ctrl+click once on the feature you want to draw, such as a building. ENVI will find the edges of the feature and complete the shape; right-click and select Accept Multi-Part.
- Complete the line or shape with the following:
- Double-click to set the end point and accept the line or shape.
- Right-click and select Complete and accept type
- Right-click on a polygon and select Complete type, then either double-click to accept it or right-click and select Accept type
- To add more paths or areas, right-click and select Add > type, then repeat the previous steps to create the line or shape. When adding, do not use the New menu as you will lose any lines or shapes you previously drew.
To clear paths or areas from the view, right-click and select Reset.
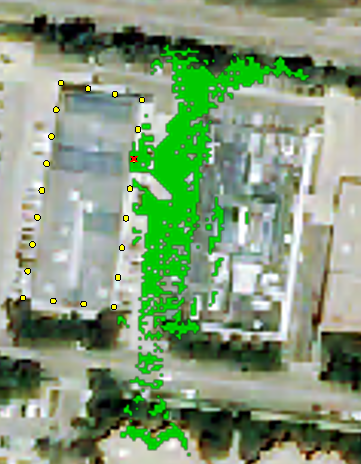
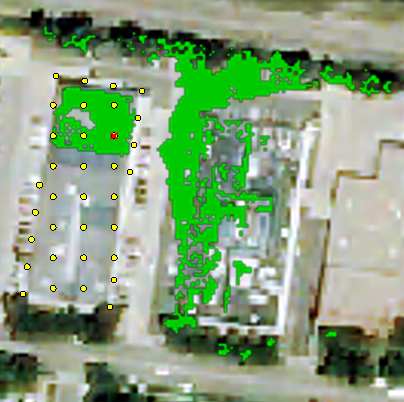
In the example image below, a Polygon Path follows the edge of a rooftop. The yellow vertices are a path of observer points. The red vertex is the selected observer point and green pixels show what is visible from that observer point.
In the next image is a Filled Polygon. The yellow vertices that fill the polygon are observer points. The red vertex is the selected observer point, and green pixels show what is visible from that observer point.
Add Observer Points from a Vector File
If a vector file is associated with your data, you can use the vectors to create paths or areas.
- Right-click on the image and select New > From Vector. The Select Record Subset dialog appears, with each vector listed in the dialog as a separate row.
- Select the rows of vectors to import and click OK. Polylines will be added as a path. Polygons, rectangles, and ellipse will be added as filled areas.
Save and Restore Observer Points in JSON Format
You can save the observer points you added to a JSON file to share with others or to restore in another ENVI session.
- To save the observer points to JSON, select File > Save locations to file and specify a path and filename in the Save Viewshed Points to File dialog.
- To restore points saved to a .json file, select File > Restore locations from file and select the file to restore in the Select Viewshed Points File dialog.
Manually Step Through the Observer Points
You can manually step through what can be seen from each observer point in a path or area as follows:
- Click an observer point to see what is visible from it.
- Click to select an observer point, then press the left/right Arrow keys on the keyboard to step forwards or backwards through the points one-by-one. Hold the Arrow key to continuously step through the points. If you create multiple paths/areas, you will progressively step through one path/area to the next one.
You can also animate stepping through the points described in the next section.
Animate the Results
Use animation to automate stepping through all observer points one-by-one and examine the viewshed or reverse viewshed for each. If you draw multiple paths or areas, the animation will cycle through each point of one path or area then automatically move to the next path/area to animate.
The player buttons are near the bottom of the Viewshed Tool dialog:

The buttons do the following:
Generate Full Results and Heatmap
If one or more individual points, paths, or areas are drawn on the image, you can generate the following layers:
Use the steps below to generate the output:
- In the Viewshed Tool dialog, enable the Classification and/or Heatmap check boxes and click the Full Viewshed button. ENVI processes the results and adds Full Viewshed and Full Viewshed Heatmap layers to the Layer Manager.
- The Full Viewshed layer overlays the image and displays classes for Out of Range (purple) Full Viewshed (green) and Full Hidden (gray).
- The Full Viewshed Heatmap layer is below the Full Viewshed layer in the layer stack. You can toggle each layer on or off to hide them or move one layer above another to see the results in each. The Full Viewshed Heatmap is a color-coded histogram count of how many times a given pixel was seen.
- The heatmap color table shows dark to light blue pixels for areas seen the least, orange to red pixels for areas seen the most, and green to yellow pixels for areas of moderate visibility. You can change the color table used by the heatmap in the Edit Color Table dialog. Click the Edit Heatmap Color Table button
 to open the dialog. See Edit Color Tables for details.
To save the results:
- In the Viewshed Tool menu bar, select File > Products > <type>, where <type> is Save "Full Viewshed Heatmap" to File or Save "Full Viewshed" to File.
- In the Please Select a File for Writing dialog, specify the path and filename for the output.
- Click Save.
Observer Point Properties
Properties for the observer point are located on the right side of the Viewshed Tool dialog. Any changes you make to the settings will be retained throughout the ENVI session, but they will revert to the defaults when you exit ENVI.
The Vertex Interval (m) property applies to the spacing between vertices in path and areas. The default is 10.
The properties displayed depend on whether the Mode is set to Viewshed (Observers) or Reverse Viewshed (Targets).
Viewshed Properties
Observer Name: The name of the observer point. Default names are "Observer" when there is a single point and "Observer #n" when there are multiple points.
Observer Range (m): The range of analysis (in meters) for each observer point. Locations outside this radius will be defined as out of range. The default is 250.
Observer Height (m): The height (in meters) of the observer point. The default is 2.
Observer Azimuth: The horizontal orientation (in degrees) of the observer point clockwise from North. The default is 0 (North).
Horizontal FOV: The horizontal range (in degrees) of the observer point. The default is 360.
Observer Pitch: The tilt angle (in degrees) of the observer point line of sight. The default is 0 (horizontal).
Vertical FOV: The vertical range (in degrees) of the observer point. The default is 180.
Viewshed: Enable the check box to add a Viewshed layer in the Layer Manager. The Viewshed layer shows all areas within the Observer Range that are visible to the observer point. To change the display color of the visibility ROI, click the down arrow next to the color box to open the color picker.
Hidden: Enable the check box to add a Hidden layer in the Layer Manager. The Hidden layer shows all areas within the Observer Range that are not visible to any of the observer points. To change the display color of the layer, click the down arrow next to the color box to open the color options.
Reverse Viewshed Properties
Target Name: The name of the target. Default names are "Target" when looking at a single observer point and "Target #n" when looking at multiple observer points.
Target Range (m): The range of analysis (in meters) for each target. Locations outside this radius will be defined as out of range. The default is 250.
Target Height (m): The height (in meters) of the target. The default is 2.
Observer Height (m): The range of analysis (in meters) for each observer point. Locations outside this radius will be defined as out of range. The default is 250.
Reverse Viewshed: Enable the check box to add a Reverse Viewshed layer in the Layer Manager. The Reverse Viewshed layer shows all areas within the Target Range that can view the observer point. To change the display color of the visibility ROI, click the down arrow next to the color box to open the color picker.
Hidden: Enable the check box to add a Hidden layer in the Layer Manager. The Hidden layer shows all areas within the Target Range that are not visible to any of the targets. To change the display color of the layer, click the down arrow next to the color box to open the color options.
See Also
Interactive Viewshed Analysis Tutorial, Calculate Viewshed Analysis (ENVI LiDAR)