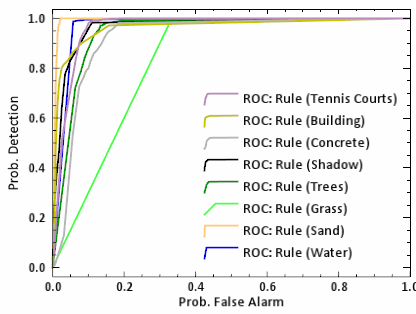
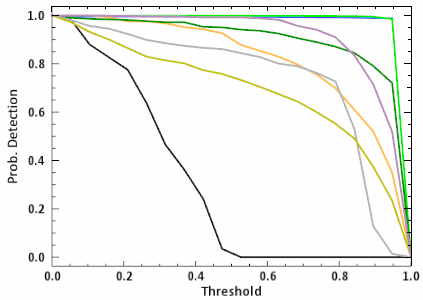
Use ROC Curves to compare post-classification rule images of different thresholds with ground-truth information. Receiver Operating Characteristic (ROC) curves are used to visualize the performance of a classifier so that you can select a proper decision threshold.
See the following sections:
Background
ENVI can calculate a ROC curve using a ground-truth image or region of interest (ROI). The ROC Curves tools create the following plots:
- Curves of the probability of detection (Pd, also called true positive rate) versus the probability of false alarm (Pfa, also called false positive rate). There is one curve for each rule (class) in the rule image ; for example:

- Optional: Curves of the probability of detection (Pd, also called true positive rate) versus the threshold. There is one curve for each rule (class) in the rule image; for example:

The probability of detection defines how many correct positive results occur among all positive samples. The probability of false alarm defines how many incorrect positive results occur among all negative samples.
ENVI classifies rule images at n evenly spaced thresholds (where n is the number of points along the ROC curve) from a specified minimum and maximum value. Each classification is compared to the ground truth and becomes a single point on the ROC curve.
Reference: Bradley, A. P. "The Use of the Area Under the ROC Curve in the Evaluation of Machine Learning Algorithms." Pattern Recognition 30, No.7 (1997): 1145-1159.
Before You Begin
To use the ROC Curves Using Ground Truth Image or ROI Curves Using Ground Truth ROI tool, you must first generate rule images from a supervised classification method. See Rule Images in Supervised Classification for more information on how to create rule images and what their pixel values represent.
Use Ground Truth Images
Follow these steps to display ROC curves using a ground truth image:
- Display a previously saved rule image, along with a ground-truth image.
- From the Toolbox, select Classification > Post Classification > ROC Curves Using Ground Truth Image. The Rule Input File dialog appears.
- Select the rule image and perform any optional spatial and spectral subsetting, then click OK. Each band selected in the rule image is used to generate a ROC curve. Each rule band is mapped to a ground-truth class.
- From the Input File dialog, select the ground truth image and perform any optional spatial subsetting, then click OK. The Match Classes Parameters dialog appears.
-
Match the ground truth classes with the rule image classes by selecting the matching names in the two lists and clicking Add Combination. The class combinations display in a list at the bottom of the dialog. If the ground truth and classification classes have the same names, they are matched automatically.
To remove a class match from the list, select the combination name. The two class names reappear in the lists at the top of the dialog.
- Click OK. The ROC Curve Parameters dialog appears.
- Click the Classify by toggle button to select whether to classify the rule image by minimum value or maximum value. For example, if your rule images are from the Minimum Distance or Spectral Angle Mapper classifier, then classify by minimum value. If your rule images are from the Maximum Likelihood classifier, then classify by maximum value.
- In the Min and Max fields, enter the minimum and maximum values for the ROC curve threshold range.
Tip: A suggested method is to use the range of data values in your rule image. To determine these values, right-click on the rule image in the Layer Manager and select Quick Stats. Note the Min and Max value for each band.
- In the Points per ROC Curve field, enter the desired number of points along the ROC curves. This value determines the number of evenly spaced thresholds to use. The default value is 20.
- In the ROC curve plots per window field, enter the number of plots per window. The default value is 8.
- Select whether to output probability of detection versus threshold plot by selecting the Yes or No check box.
- Click OK. The ROC curves and probability of detection curves appear in separate plot windows.
Use Ground Truth Regions of Interest
Follow these steps to display ROC curves using ROIs for ground truth:
- Display a previously saved rule image, along with a ground-truth ROI file.
- From the Toolbox, select Classification > Post Classification > ROC Curves Using Ground Truth ROIs. The Rule Input File dialog appears.
-
Select the rule image and perform any optional spatial and spectral subsetting, then click OK. Each band selected in the rule image will be used to generate the ROC curve. Each rule band is mapped to a ground truth ROI. The ground truth ROIs must be opened and associated with an image of the same size as the selected rule image. The Match Classes Parameters dialog appears with the ROIs automatically be loaded into it.
If the ground truth ROIs were defined on an image of a different size, you can use Basic Tools > Region of Interest > Reconcile ROIs to make them compatible with your rule image.
-
Match the ground truth classes with the rule image classes by selecting the matching names in the two lists and clicking Add Combination.
The class combinations display in a list at the bottom of the dialog. If the ground truth and classification classes have the same names, they are matched automatically.
To remove a class match from the list, select the combination name. The two class names reappear in the lists at the top of the dialog.
- Click OK. The ROC Curve Parameters dialog appears.
- Click the Classify by toggle button to select whether to classify the rule image by minimum value or maximum value. For example, if your rule images are from the Minimum Distance or Spectral Angle Mapper classifier, then classify by minimum value. If your rule images are from the Maximum Likelihood classifier, then classify by maximum value.
- In the Min and Max fields, type minimum and maximum values for the ROC curve threshold range.
Tip: A suggested method is to use the range of data values in your rule image. To determine these values, right-click on the rule image in the Layer Manager and select Quick Stats. Note the Min and Max value for each band.
- In the Points per ROC Curve field, enter the desired number of points along the ROC curves. This value determines the number of evenly spaced thresholds to use. The default value is 20.
- In the ROC curve plots per window field, enter the number of plots per window. The default value is 8.
- Select whether to output a probability of detection versus threshold plot by selecting the Yes or No check box.
- Click OK. The ROC curves and probability of detection curves appear in separate plot windows.