You can overlay grid lines on the full extent of the view, or, for rasters, you can specify a spatial subset on which to overlay them. The View must contain a base projection established by a raster, vector, or other projected layer to use Grid Lines.
See the following sections:
You can also write a script to overlay grid lines using the ENVIView::CreateGridLinesLayer method and the ENVIGridLinesLayer routine.
Set Grid Lines
Grid lines with coordinate labels will be added to the Layer Manager as Grid coordinate_system.
To overlay grid lines on the full extent of the view, use one of the following:
- Select File > New > Grid Lines Layer from the menu bar.
- Right-click on given View in the Layer Manager and select New > Grid Lines Layer.
- Click the Annotations drop-down list in the ENVI toolbar and select Grid Lines.
- Right-click on a raster layer in the Layer Manager and select New Grid Lines Layer. In the Select Spatial Subset dialog that appears, click the Use Full Extent button
 .
.
To overlay grid lines on a spatial subset of a raster, do the following:
- Right-click on a raster layer in the Layer Manager and select New Grid Lines Layer. The Select Spatial Subset dialog appears.
- Click the Subset by Raster button
 . The Data Selection dialog appears.
- Select the raster to use for the subset and click OK.
- In the Select Spatial Subset dialog, specify column and row ranges, or click and drag the lines around the image to select the subset.
- Click OK.
If you add more files into the View, one of the following will occur:
- When grid lines are on the full extent of the view, they will update to overlay the new full extents.
- When grid lines are on a spatial subset, they will remain on the subset and will not change.
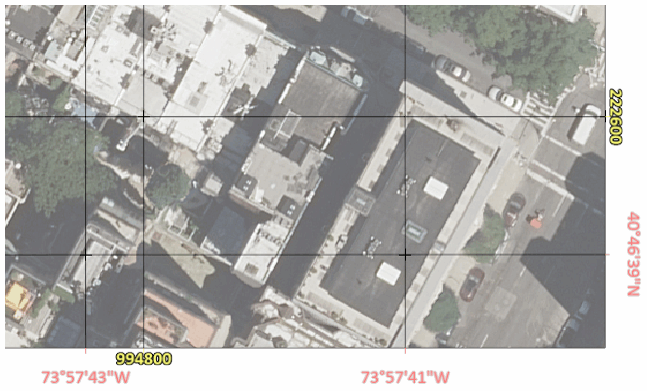
You can have multiple sets of grid lines, each in a different coordinate system. Use any of the methods described previously to add a new grid lines layer. Then, with the new grid layer selected, go to the Layer properties below the Toolbox and click the down arrow next to the Coordinate System to select a open the Select Coordinate System dialog. Select a new coordinate system and click OK. The following figure shows an example of displaying State Plane coordinates (yellow) along with Geographic WGS-84 latitude and longitude coordinates (pink):
To remove grid lines from the View, right-click on the Grid layer in the Layer Manager and select Remove.
Change Grid Line Properties
Properties of a grid line layer are displayed beneath the Toolbox in the lower-right corner of the ENVI application. Update the following properties as needed.
- Coordinate System: The coordinate system associated with the grid lines. To change to a different coordinate system, click the white space in the Coordinate System field. Click the arrow button that appears. Refer to the Select Coordinate Systems topic for further instructions.
- X Spacing: The spacing of grid lines in the X-direction, in the units of the current coordinate system (for example, in meters for a UTM projection).
- Y Spacing: The spacing of grid lines in the Y-direction, in the units of the current coordinate system.
- Show Grid Lines: This property is set to True by default to display the inner grid lines. Set it to False to hide the inner grid lines.
- Show Intersections: This property is set to True by default to display crosshairs at grid line intersections. Set it to False to hide the intersections.
- Show Bounding Box: This property is set to True by default to display a bounding box along the edge of the grid.
- Show Text: This property is set to True by default to display coordinate labels along the outside edge of the grid. Set it to False to hide coordinate labels.
- The next nine properties pertain to coordinate labels: Text Font Name, Text Font Style, Text Color, Background Method, Background Color, Text Orientation X-Axis, Text Orientation Y-Axis, Text Offset. The Text Offset property controls how far away the coordinate labels are from the grid lines.
- Geographic Format: Select a format for displaying coordinates when the grid represents a geographic coordinate system. The choices are Degrees, Minutes, Seconds (default), Degrees (in decimals), and Degrees, Minutes.
- Geographic Precision: Select the number of decimal places displayed for any Geographic Format setting.
- Grid Color: Choose a color for the grid lines and bounding box (if displayed).
- Grid Thickness: Set the thickness, in pixels, for the grid lines, intersections, and bounding box.
- Grid Linestyle: Set the line style of the grid lines, intersections, and bounding box.
- Intersection Symbol Size: Set the size, in pixels, of grid line intersections when Show Intersections is set to True.
These settings persist until you close the ENVI session; to change the default settings, go to Annotation > Grid Lines in the ENVI Preferences dialog.
Create Output
Choose one of the following options to export a dataset with grid lines to a file on disk:
- Use the File > Export View to > Image File menu option to save raster layers with grid lines to RGB 24-bit image files.
- Use the File > Chip View to > Powerpoint option to export vector and raster layers with grid lines to a Powerpoint presentation.
Examples
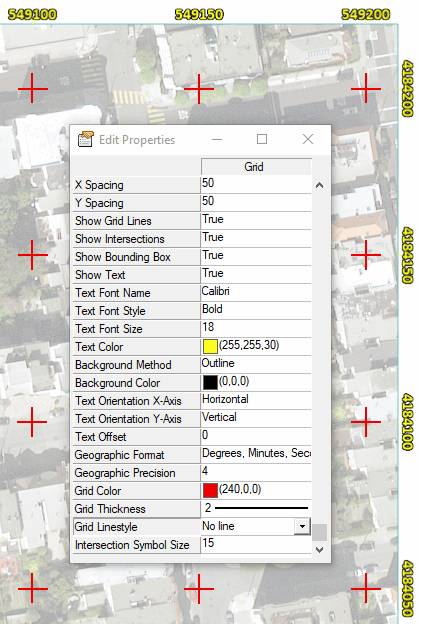
The following example shows how to display intersections only. Grid lines, intersections, and bounding boxes all inherit the same values when you change the Grid Color, Grid Thickness, and Grid Linestyle properties.
See Also
Annotations, Map Information in ENVI, Select Spatial Subset, Views